

A Simple Introduction to Quantitative Equity Investing
How to Use Decile Portfolios to Identify Potential Winners

Over the past few decades, financial researchers have spent a lot of time trying to answer a deceptively simple question:
Which stocks are more likely to outperform?
At first, this is not a question about stories, forecasts, or narratives. It is a question about characteristics. Are cheaper stocks more attractive? Do recent winners keep winning? Do more profitable companies earn higher returns?
Once a pattern appears in the data, a second and deeper question follows: why does it exist?
One of the cleanest ways to study this problem is through decile portfolios. The idea is straightforward: at the end of each month, take a universe of stocks, sort them based on a specific metric, and divide them into ten equal groups (aka deciles). The first decile contains the stocks with the lowest values for that metric, while the tenth decile contains the stocks with the highest values.
Researchers then track the returns of each decile during the following month, repeat the procedure month after month, and study the resulting performance over time.
This simple framework has become one of the most widely used tools in quantitative finance because it helps researchers understand whether certain stock characteristics are associated with higher future returns.
The Value Effect
One of the most famous examples is the value effect. In this case, stocks are often ranked by their book-to-market ratio. Historically, companies with high book-to-market ratios, commonly referred to as value stocks, have tended to outperform companies with low book-to-market ratios, often called growth stocks.
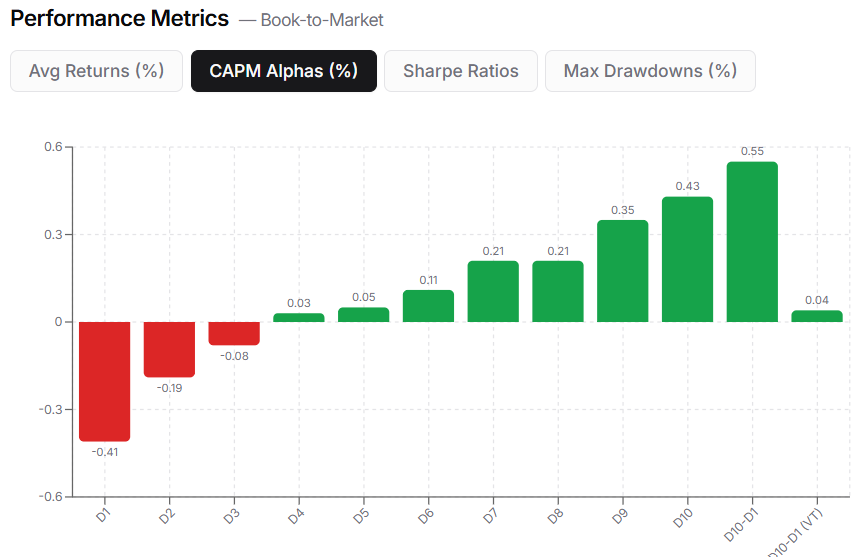
This raises a fundamental question:
Are these return differences a fair compensation for bearing additional risk, or do they reflect market mispricing?
The traditional risk-based explanation, associated with Fama and French, is that value stocks are riskier. They often represent companies facing uncertainty, financial stress, or weaker growth prospects. Under this interpretation, their higher expected returns are compensation for bearing additional risk.
However, the behavioral finance perspective, advanced by researchers like Lakonishok, Shleifer, and Vishny, argues that investors systematically overpay for growth stocks and undervalue value stocks, leading to predictable mispricing. They attribute this behavior to representative bias, where investors naively extrapolate past earnings growth rates too far into the future.
Momentum: The “Premier Anomaly”
While the value factor can be understood as a compensation for additional risk, the momentum factor, introduced by Jagadeesh and Titman in 1993, challenged the efficient market hypothesis. Unlike value, which has a clear risk-based rationale, momentum relies purely on past price movements.
The classic momentum factor, constructed using historical stock prices, quickly earned the title of premier anomaly.
In momentum investing, stocks that have performed well over the past 12 months (excluding the most recent month) tend to continue outperforming, while underperformers continue lagging.
The chart below illustrates the annualized alphaof portfolios formed on past 12-month returns, demonstrating that the highest momentum stocks (Decile 10) have significantly outperformed the lowest momentum stocks (Decile 1).
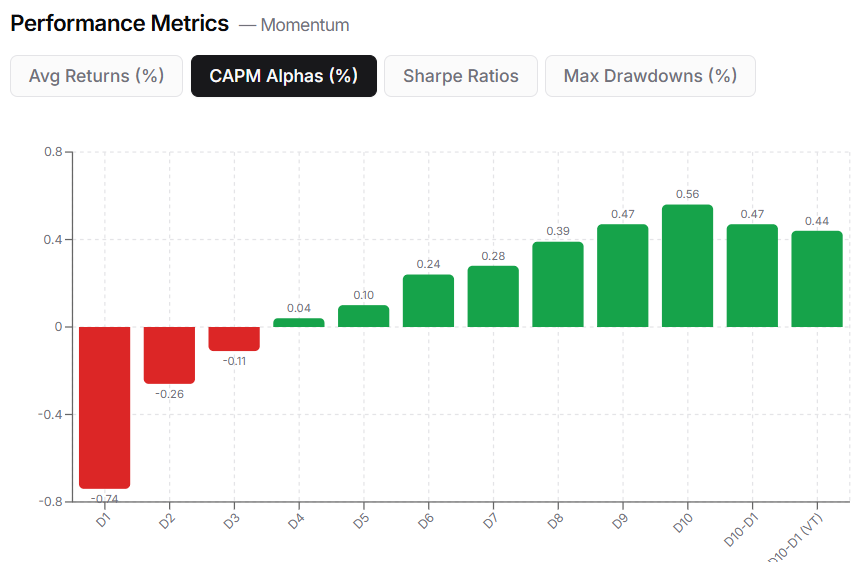
However, long-short momentum strategies have historically suffered from sharp drawdowns, particularly during major market rebounds following large sell-offs (e.g., 1932, 1939, and 2009). These extreme reversals pose significant challenges for momentum investors, as past winners often experience abrupt underperformance.
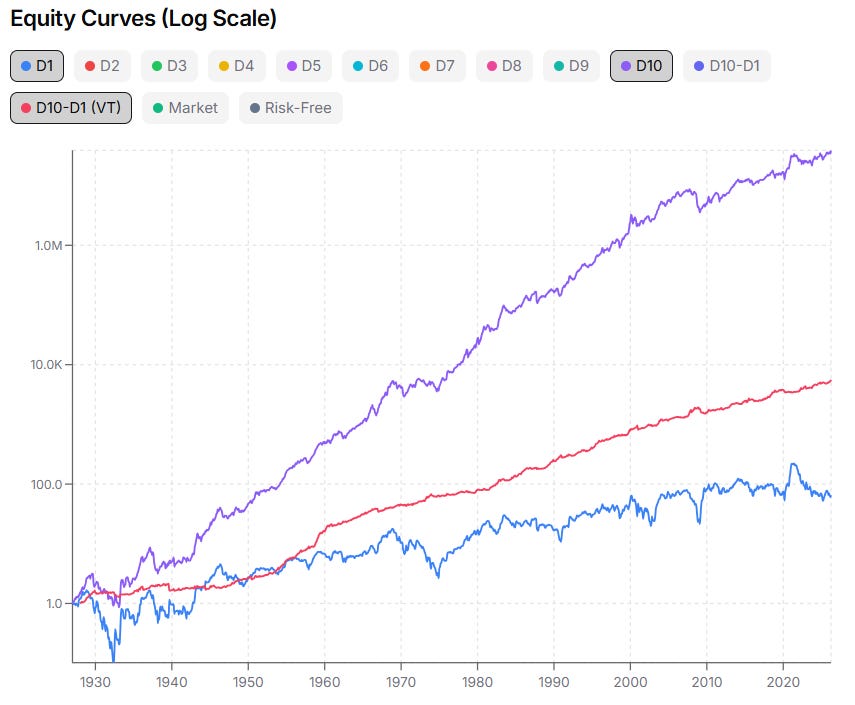
A more refined approach, proposed by Pedro Barroso and Pedro Santa Clara, dynamically adjusts exposure to momentum based on recent volatility. Their risk-managed momentum strategy smooths the equity curve and mitigates extreme losses, making it a more resilient implementation of momentum investing.
The red line in the chart below illustrates this enhanced approach, demonstrating how adjusting for risk significantly improves the stability and long-term performance of momentum-based portfolios.
Why Does Momentum Exist?
Momentum is often explained through behavioral biases and limits to arbitrage. Investors may underreact to new information, allowing price trends to persist longer than they should. Later, they may overreact, pushing prices too far in one direction.
Our interpretation of trend persistence is closely related to the idea of slow-moving capital, a topic we discussed in a previous post.

In that piece, we argued that trends are often not the cause of market moves, but the visible trace left behind by a deeper adjustment process.
Even when information is public, capital does not always move instantly toward the most attractive opportunities. Investors face mandates, risk limits, career concerns, liquidity constraints, and operational frictions. A large institution cannot simply read a piece of news and immediately buy or sell billions of dollars of exposure without affecting the market. Information becomes price gradually because capital, interpretation, and execution all take time.
This slow adjustment can help explain why trends persist. At the same time, practical frictions prevent arbitrageurs from eliminating the anomaly completely. Trading costs, short-selling constraints, liquidity limits, and institutional restrictions all make it difficult to exploit these patterns perfectly.
Beyond Value and Momentum
Over time, researchers have identified many other characteristics associated with stock returns. Among the most studied are:
Low volatility: stocks with lower historical volatility have often delivered attractive risk-adjusted returns.
Profitability or quality: companies with strong earnings, stable cash flows, and high returns on capital tend to perform well.
Investment: firms with disciplined capital expenditure policies have often outperformed more aggressive investors.
Liquidity: less liquid stocks may offer a premium to compensate investors for higher trading costs and lower marketability.
However, the growing number of published factors has created a new problem: not every discovered factor is real. Some may simply be the result of data mining, where thousands of signals are tested until something appears statistically significant by chance.
How to Identify a Reliable Factor
To separate robust factors from statistical noise, researchers and practitioners often rely on a few common-sense criteria.
For example, Larry Swedroe and Andrew Berkin suggest that a factor expected to continue delivering excess returns should be:
Persistent: it should work across different time periods and market regimes.
Pervasive: it should appear across markets, geographies, or asset classes.
Robust: it should survive reasonable changes in definitions and methodology.
Intuitive: it should have a plausible economic or behavioral explanation.
Investable: it should be implementable after accounting for transaction costs, liquidity, and real-world constraints.
These criteria do not guarantee that a factor will keep working in the future. But they help distinguish serious research from statistical coincidence.
Concretum Factor Tracker
One of the practical difficulties of factor investing is that monitoring these effects requires data, programming skills, and time.
In principle, investors can track dozens of characteristics and factor definitions, many of which also appear in the Kenneth French Data Library: size, book-to-market, operating profitability, investment, momentum, short-term reversal, long-term reversal, earnings-to-price, cashflow-to-price, dividend yield, accruals, market beta, and net share issues, among others.
To make this easier, we developed a free web application that provides up-to-date performance statistics and charts for a broad set of academic-style equity factors and stock characteristics.
All the charts used in this article were generated with this tool.
You can try this tool by clicking the button below!
The tool is currently FREE and designed for investors, researchers, professors, and students who want to explore factor investing in a more accessible way.
Since it is still evolving, feedback and suggestions are very welcome.
If you have any ideas or comments, feel free to contact us via email at info@concretumgroup.com or by leaving a comment below.
If you found this article useful, feel free to leave a comment and reach out via direct message or email at info@concretumgroup.com for any questions.

Disclaimer
This publication is provided by Concretum Group for informational, educational, and research purposes only. It does not constitute investment, financial, legal, or tax advice, nor a recommendation to buy or sell any security, instrument, strategy, or investment product. All investments involve risk, including possible loss of principal. Past performance, backtested performance, and historical analysis are not reliable indicators of future results. Readers should conduct their own research and consult qualified professionals before making investment decisions.
Full disclaimer: https://concretumgroup.com/disclaimer/
The factor tracker and the factor comparison heatmap where I can adjust the L/S or VW/EW are the best tool I've ever found. Maybe Concretum can add the Quality Minus Junk data or HML devil from AQR dataset. There should also be Industry/Sub-Industry momentum, maybe from FRED: Nasdaq US Benchmark. Anyway, thanks for the tool, super useful 10/10!