

Free Quantitative Trading Tools & Research Apps
Everything we have built and released for the quant community, in one place

Over the past few years we have shipped a growing set of free tools, interactive apps and research platforms that we originally built for our own work, then opened to students, researchers, and traders.
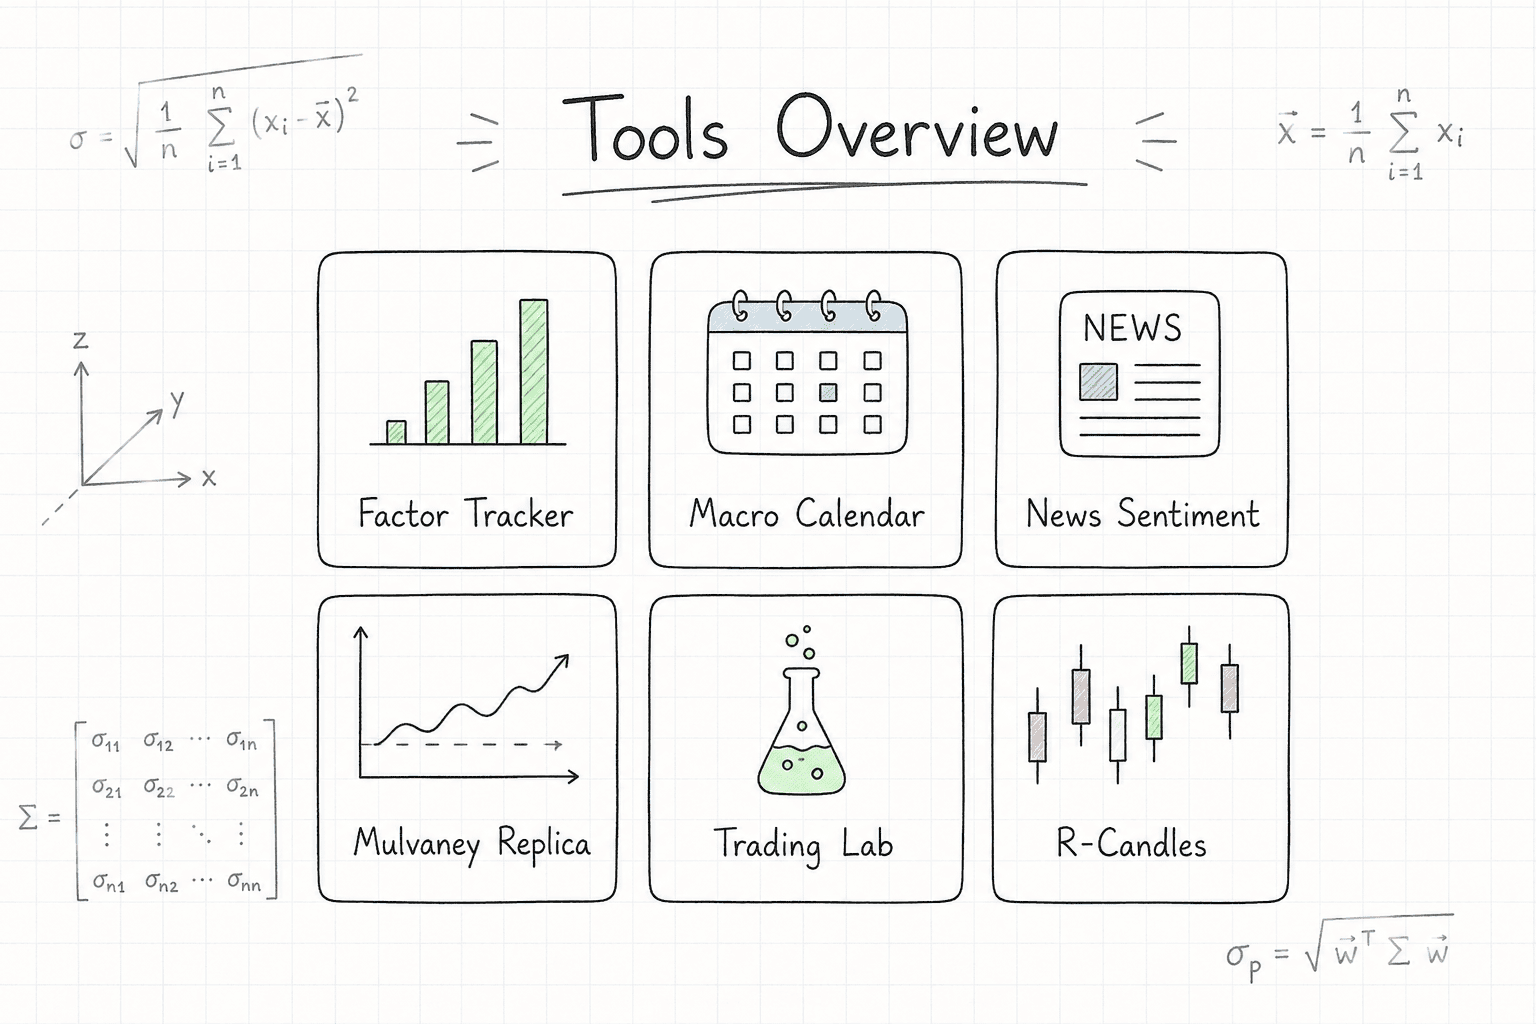
This page brings them together in one place, from factor investing and macroeconomic data to news analysis, strategy replicas, and trading research environments.
The Tools
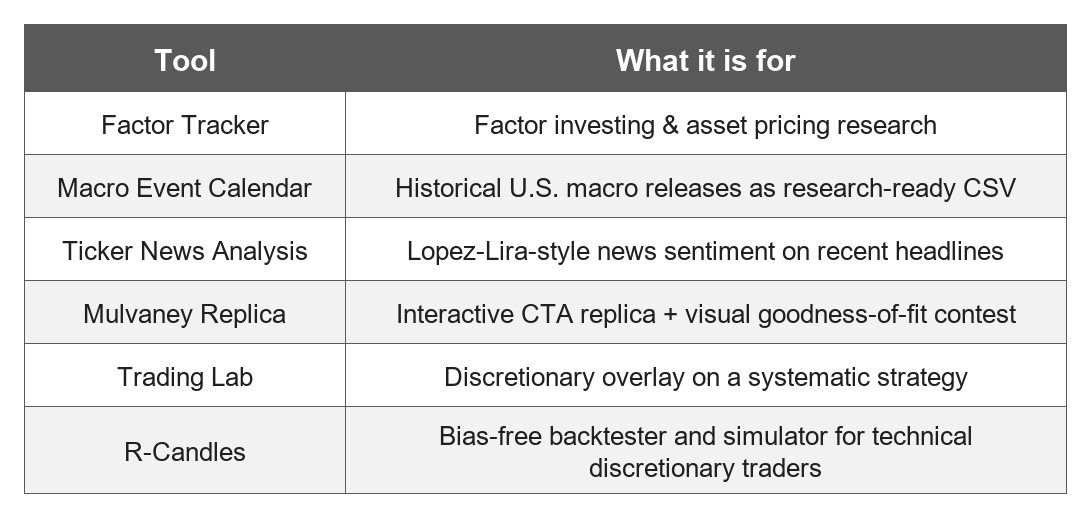
1. Factor Tracker

The Factor Tracker is a free interactive platform for exploring factor investing and asset pricing using the Kenneth French Data Library.
It is built for students, researchers, professors, and practitioners who want to visualize long-term factor It is built for students, researchers, professors, and practitioners who want to visualize long-term factor performance without downloading Zip files and wiring their own charts every time.
You can explore factors such as Momentum, Value, Volatility, and others, across decile portfolios and long-short constructions. You get:
Average returns, CAPM alphas, Sharpe ratios, and maximum drawdowns
Equity curves and underwater curves (log scale)
Summary statistics (CAGR, volatility, Sortino, beta, total return)
Periodic returns tables
A Factor Comparison Heatmap for yearly long-short returns across factors
If you teach or study asset pricing, this is often the fastest way to see what a factor actually looked like over a long sample.
2. Historical Macro Event Calendar

Most research starts with prices. Eventually it asks a second question: how does a strategy behave around scheduled macro releases?
Finding an economic calendar is easy. Finding one that is clean, consistent, and ready to drop into a research pipeline is not. So we opened the free tool we use internally.
Select the events you care about, pick a date range, and export a CSV. Events include FOMC, CPI, Non-Farm Payrolls, Unemployment, PCE, GDP, U. Michigan Consumer Sentiment, Industrial Production, Initial Jobless Claims, Retail Sales, PPI, ISM Manufacturing, ISM Services, and Conference Board Consumer Confidence.
Export layouts:
Long: one row per event occurrence, easy to filter and join
Wide: one row per trading day with 0/1 columns per event, usually what you merge into a study
The calendar includes future scheduled dates, not only history. Assumed release times are optional and off by default; treat them as estimates when you enable them.

3. Ticker News Analysis

This is our attempt at a live paper replica: an interactive version of the Lopez-Lira-style news-sentiment pipeline from Can ChatGPT Forecast Stock Price Movements?.
We built it before the more advanced Deep Research-style tools now available on ChatGPT and similar platforms. Treat it as a small, practical attempt at the paper’s idea, not a full production research stack.
The News Sentiment Analyzer gathers recent financial headlines for up to 10 tickers, scores them with Google Gemini using that style of prompt, and returns:
Per-ticker net and mean sentiment
Overall Positive / Negative / Neutral labels
Article-level scores and charts
You choose the lookback window (for example the past 24 hours) and run the analysis in the browser. Gemini is the live scorer today; other LLM backends are listed but not live yet.
Run the same tickers twice and you will often not get identical scores. The scoring step is probabilistic, so repeated runs can disagree even on the same headlines. That variability is useful to see if you care about how stable an LLM-based sentiment signal really is.
It is not a trading signal by itself. Use it as a research input alongside prices and factors.
4. Mulvaney Replica

Paul Mulvaney’s CTA track record, compounding near 20% per year over more than two decades, is one of the most studied in trend following. We reverse-engineered that style in our research series, then shipped an interactive companion so readers can experiment with the same parameter space.

Change a parameter; the backtest updates. Controls include:
Lookback (Donchian channel)
Fixed stop fraction
Pyramiding (cap and step)
Execution lag
Risk allocation (e.g. loss parity / hierarchical loss parity)
Direction and asset universe
You get the equity curve vs Mulvaney, key statistics, trade-level metrics, monthly returns, and scatter / goodness-of-fit views. This is a research backtest, not investment advice.
Visual Goodness-of-Fit Contest (currently active)
Submit the parameter combination that best captures the shape and character of Mulvaney’s track record. Winner receives a one-year membership to the Concretum Substack.
5. Trading Lab

Trading Lab is a limited-time research experiment, a discretionary overlay on a fully systematic intraday strategy.
The question we are measuring is simple. Can day-trading skill improve the performance of a systematic system when the trader does not invent entries, and only manages exposure using price action?
You sign in, work trade by trade, and your discretionary P&L is compared against the systematic baseline (and the alpha between them). Exposure adjustments are recorded so the experiment can study whether overlays help, hurt, or do nothing on average.
6. R-Candles

R-Candles is our backtester and simulator for technical discretionary traders, swing and position traders who rely on price and volume.
Unlike a typical paper-trading app, charts are drawn from a large U.S. equity history without ticker or date labels, which reduces forward-looking bias. The database includes delisted names. You can filter setups, simulate trades with realistic stop and limit orders, tag scenarios, backtest exits, and export trades to CSV. Autopilot can manage predefined targets and stops so you can review many charts quickly.
The coverage is large: 300M+ charts, 40,000+ U.S. stocks, 50+ indicators, and more than 30 years of U.S. stock data.
People use it on breakouts, VCP, episodic pivots, flags, pennants, gaps, cup-and-handle patterns, and related price-action setups, including around historical earnings dates.

These tools are what we give to the quantitative research community, interactive apps you can open in a browser and use immediately.
If you found this article useful, feel free to leave a comment or contact us by direct message or at info@concretumgroup.com.

Disclaimer
This publication is provided by Concretum Group for informational, educational, and research purposes only. It does not constitute investment, financial, legal, or tax advice, nor a recommendation to buy or sell any security, instrument, strategy, or investment product. All investments involve risk, including possible loss of principal. Past performance, backtested performance, and historical analysis are not reliable indicators of future results. Readers should conduct their own research and consult qualified professionals before making investment decisions.
Full disclaimer: https://concretumgroup.com/disclaimer/
Research Transparency Statement
Every research idea, hypothesis, methodology, dataset, code, backtest, analysis, and conclusion presented in this article was independently developed by the Concretum Group research team. Artificial intelligence tools were used as productivity assistants to support the preparation of the final manuscript, including language refinement, grammatical review, and, where appropriate, the creation of tables, figures, and other visual elements. All research decisions, analyses, interpretations, and conclusions remain entirely those of the authors.
Thanks Concretum.
You guys are wonderful
Thanks for building and sharing these fantastic tools!