


Among all the articles we published this year, “You Can Trade (Almost) Like Mulvaney” remains one of our most appreciated articles: if anything, its popularity reflects how much traders respect Paul Mulvaney and his now-legendary track record.

Trying to reverse-engineer the rules behind his program turned out to be a fascinating exercise, and we thank our readers for their support: without it, we wouldn't be able to keep this research publicly accessible.
Readers interested in the full details behind our replication pipeline, assumptions, and results can visit the original piece here.

Following several reader requests, we have extended the results of our best-fit replica through July 24 2026, offering an estimate of how Mulvaney might be positioned as the second half of the year begins.
As part of this update, we also review some of the year’s most significant trades, assess their contribution to portfolio P&L, and the lessons we can draw from them.
Importantly, this is not a disclosure of the fund's actual holdings: simply put, we take the specification we originally identified to best replicate Mulvaney's historical returns and present a rundown of its current exposures, without refitting or recalibrating the model on more recent data points.
At the end of this article, we also share a (free) interactive tool that lets you build and fine-tune your own version of the replica: read along to find out how you could win a one-year subscription to Concretum Research!
Inside Our Replica Model
As readers may recall, our original study was built around a basket of 39 futures markets spanning multiple asset classes and geographies: this remains our approximation of Mulvaney's investable universe, which has reportedly stayed unchanged since the fund launched in 1999.
The table below provides a snapshot of our best-fit replica’s holdings as of July 24, 2026. Since our model allows positions to be built through multiple tranches, each market is reported as long, short, or flat, with darker colors denoting a larger number of active tranches.
We additionally provide two measures of exposure: margin to equity and notional to equity. The former is a common metric used by CTAs to quantify how much capital is committed to supporting their positions, while the latter approximates the underlying economic exposure those positions represent.
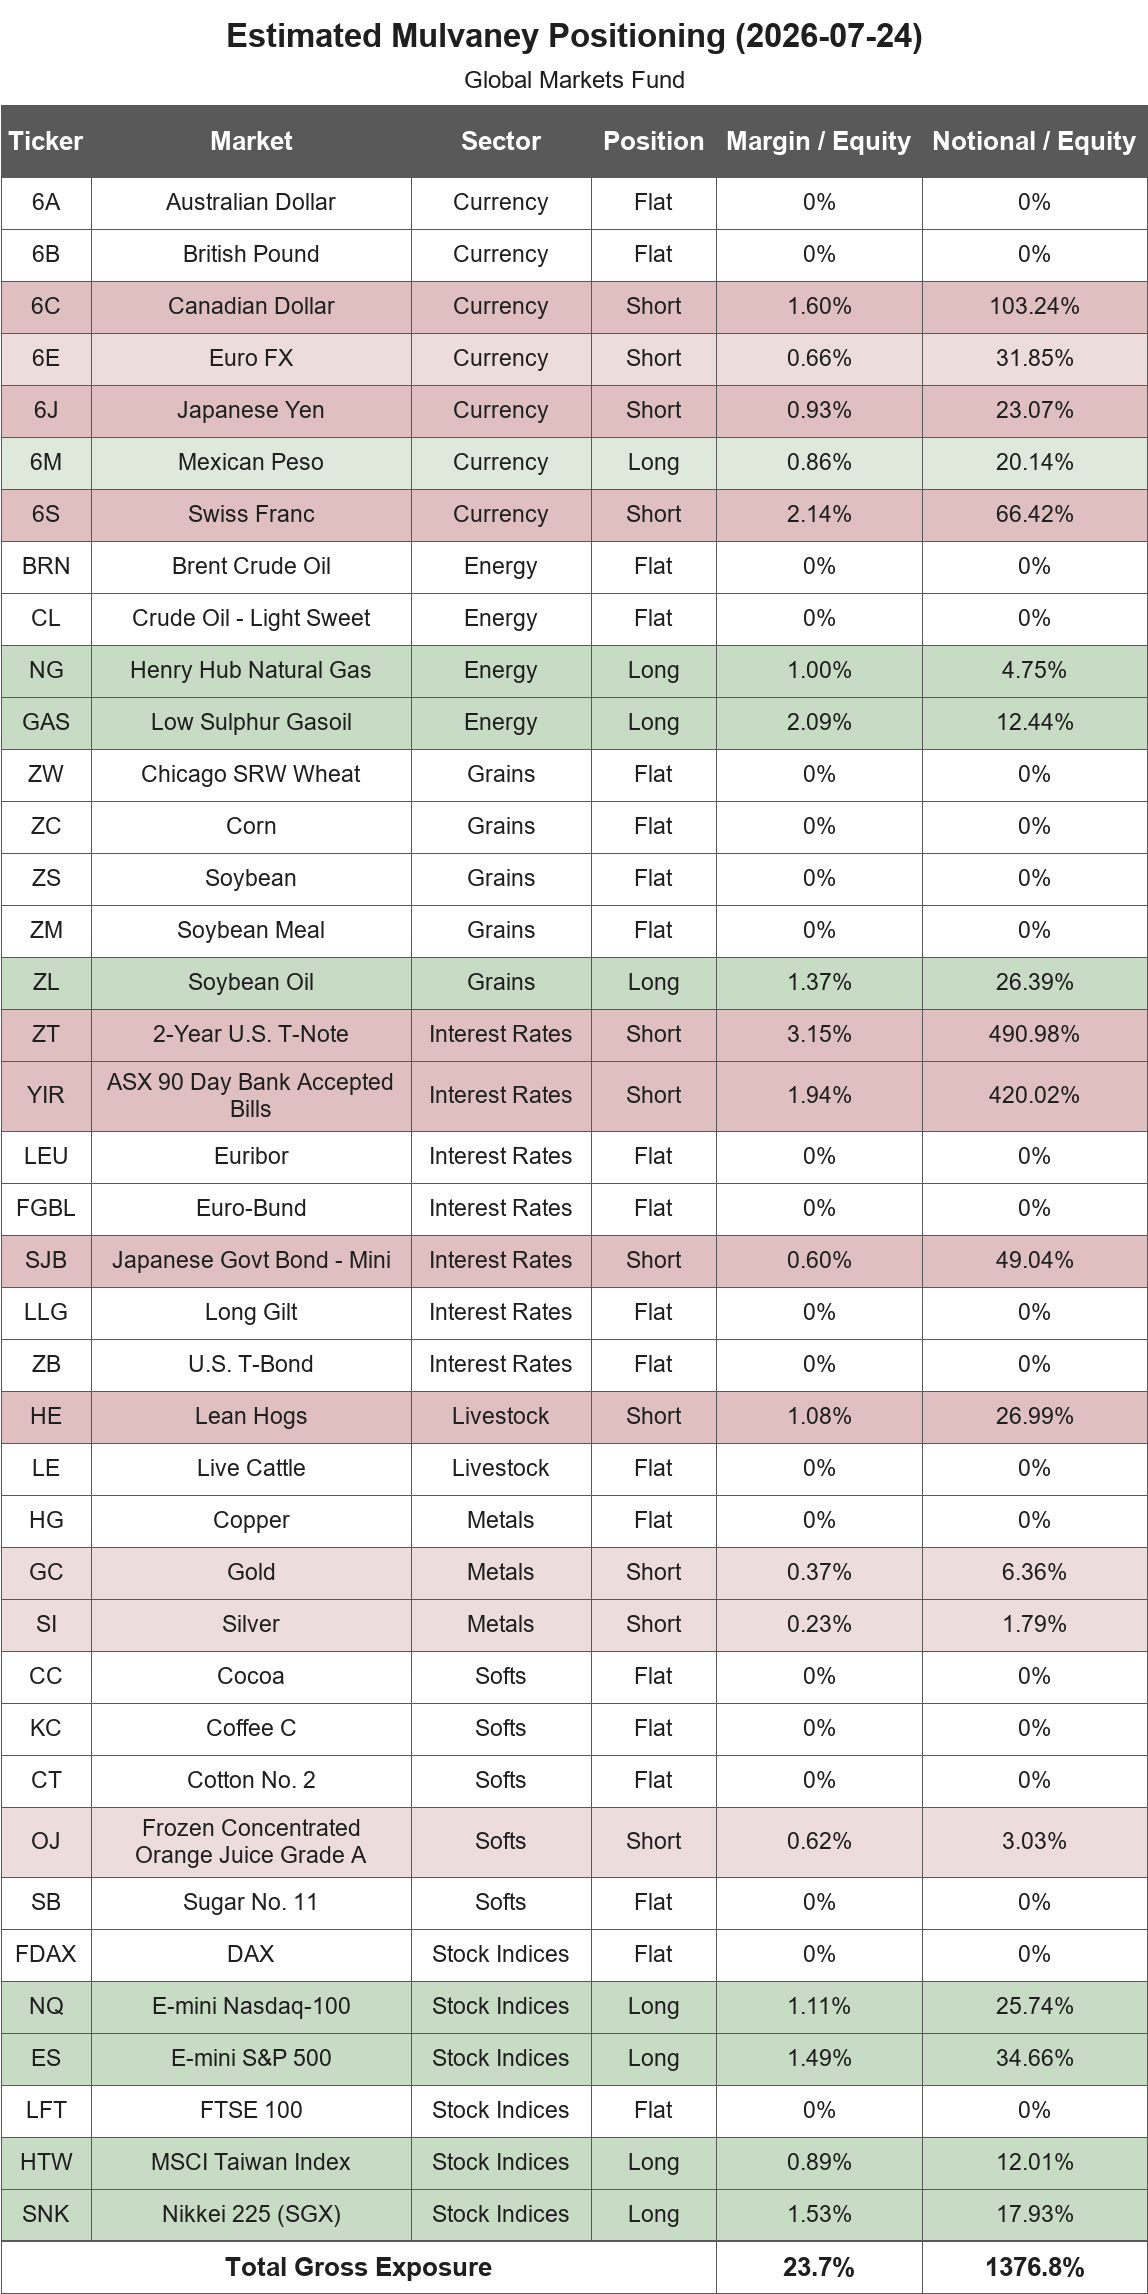
Our replica is currently positioned in 19 of its 39 tradable contracts, with 8 long positions, 11 short positions, and the remaining 20 markets flat, making for an overall mild exposure level.
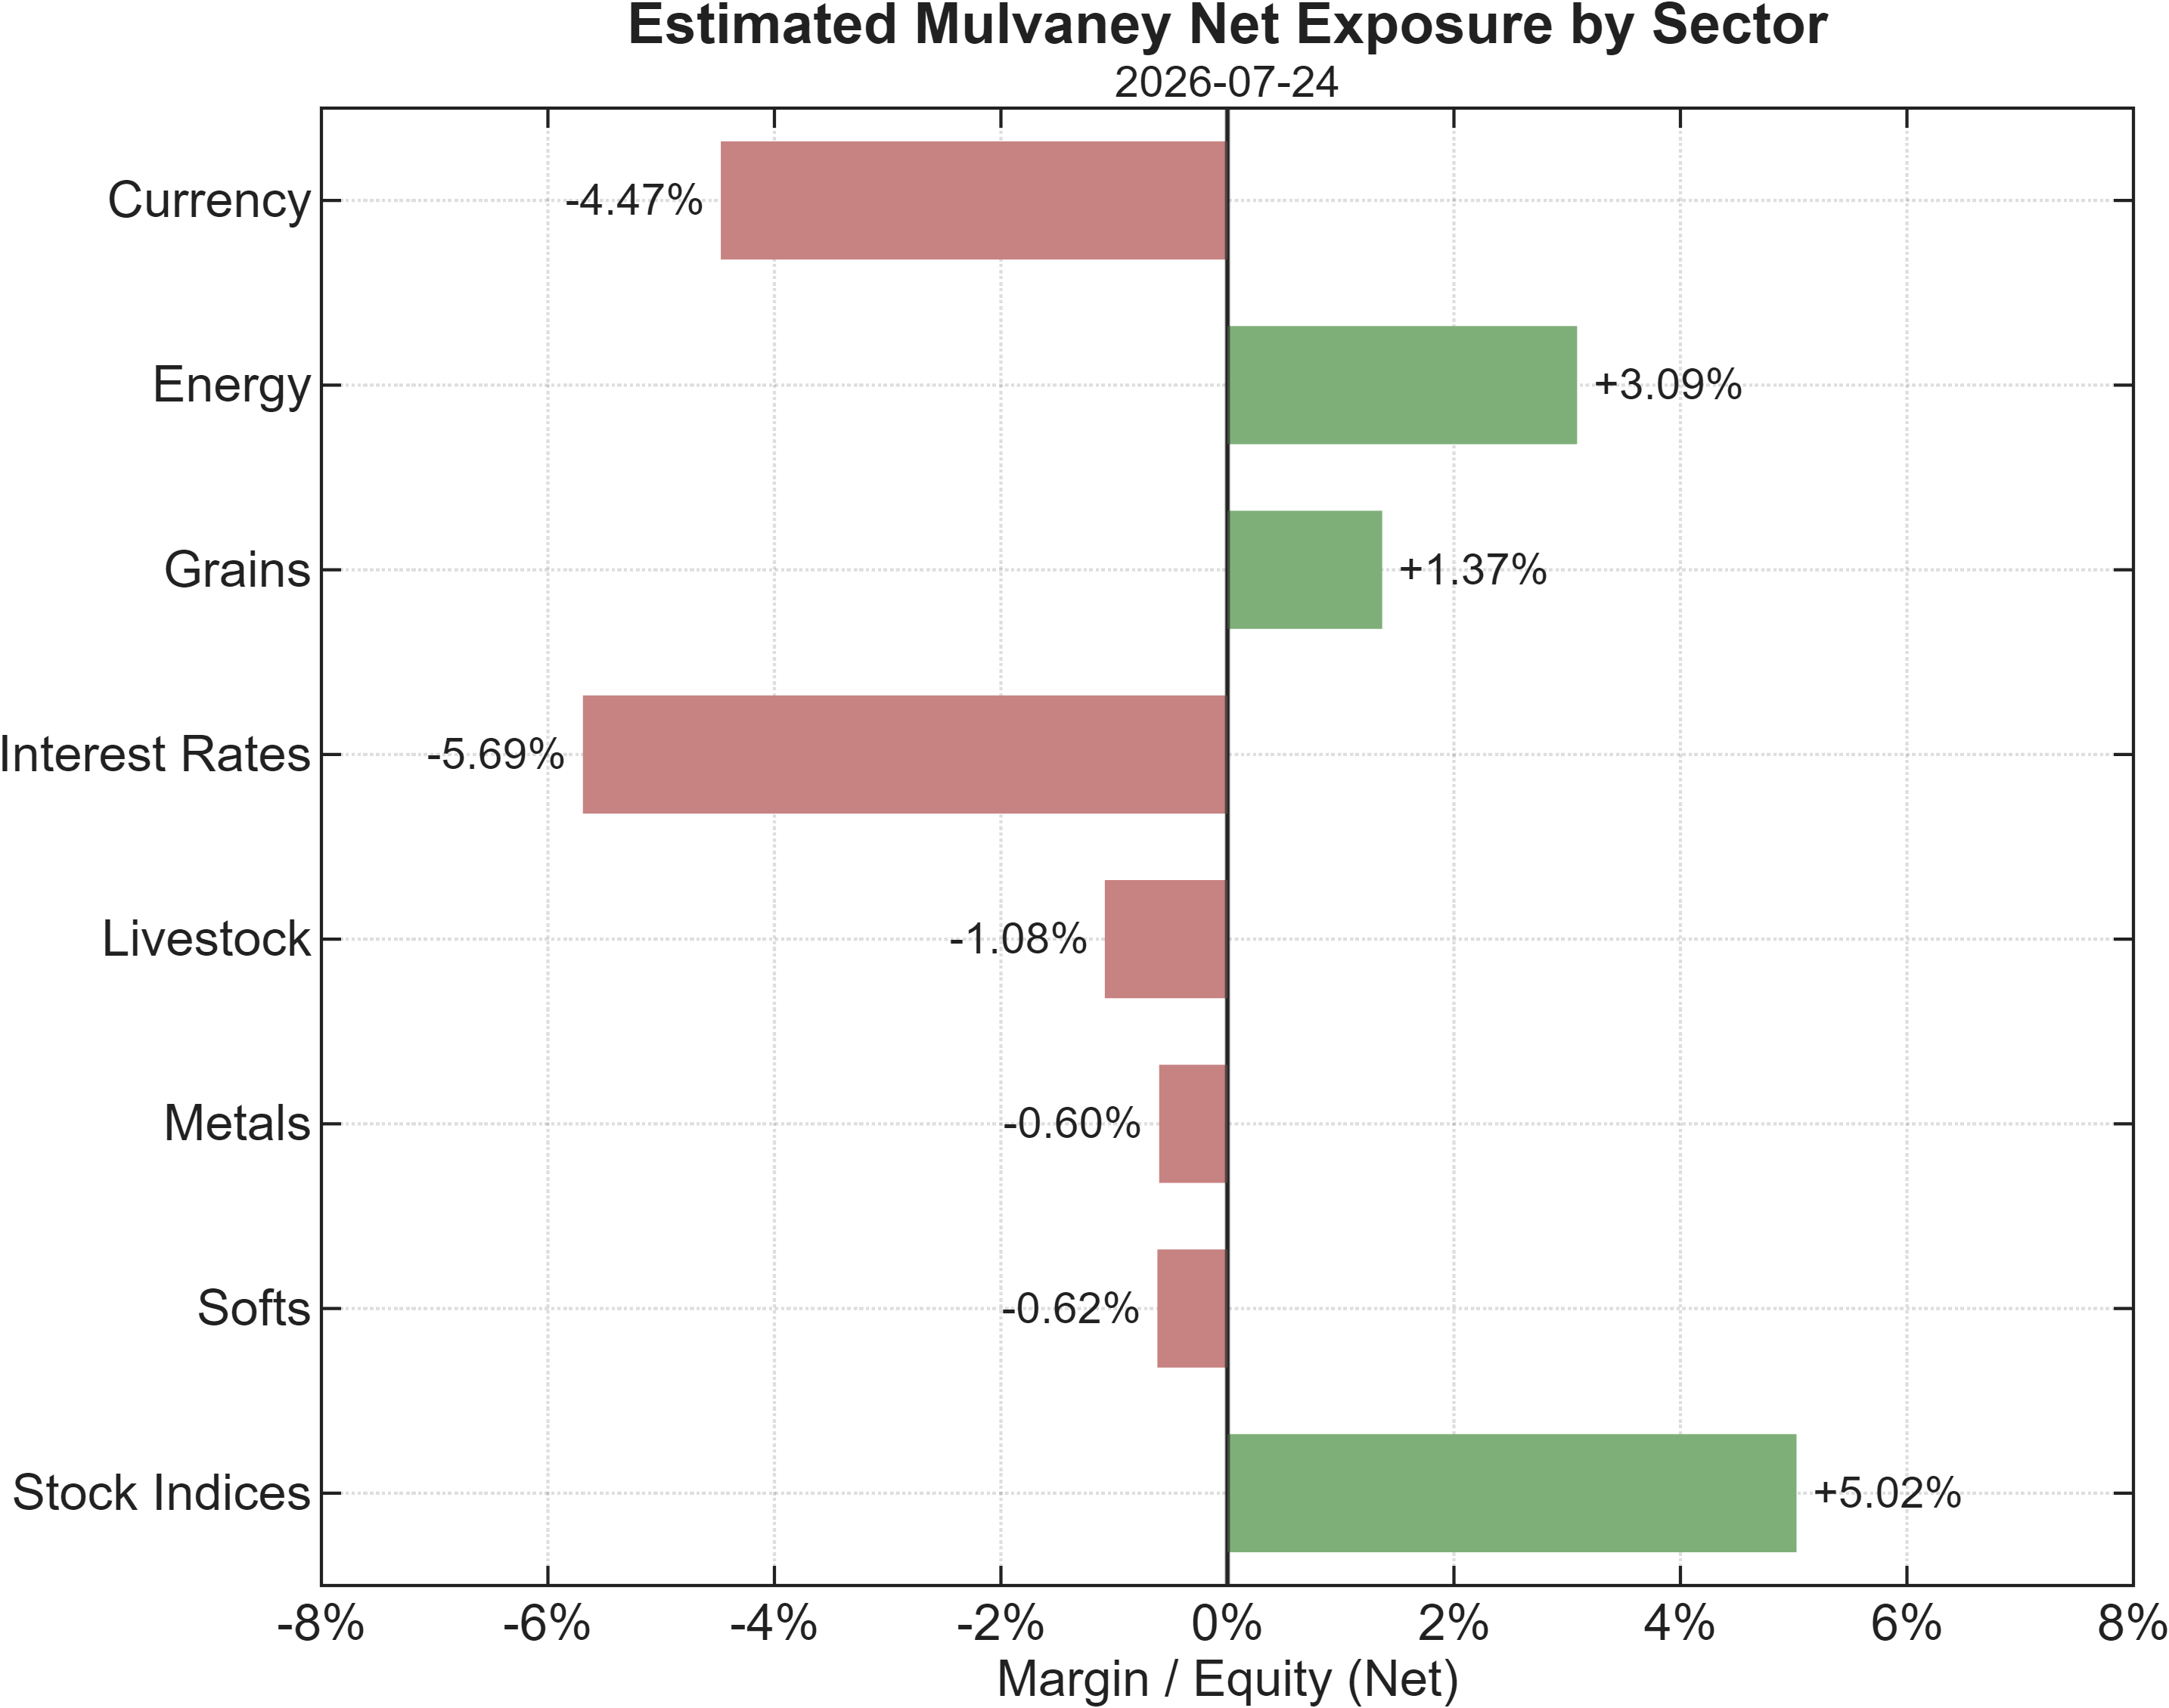
The clearest directional clusters appear in stock indices, interest rates, and currencies, with more fragmented positions across the broader commodities complex. Within those, the energy sector stands out, with long positions in Natural Gas (NG) and Low Sulphur Gasoil (GAS), alongside short exposure to metals, including both Gold (GC) and Silver (SI).
The same picture emerges when looking at net exposures by sector, where it is clear that grains, livestock, and softs currently hold only modest allocations.
We then isolate the replica’s best and worst trades initiated over the past year. Importantly, each tranche is treated as a separate trade, with its statistics evaluated independently.
The largest P&L contributor was the first (long) tranche in Brent Crude Oil (BRN), entered on January 29, 2026 and closed on June 19, 2026: against a backdrop of geopolitical tension, the trade captured much of the run-up in oil and adjacent energy markets.
Notably, this remained a remarkable trade even though the it gave back a significant portion of its open profit before exiting, as is typical of canonical trend-following programs. Such models are not meant to pick tops and bottoms; rather, they aim to capture the “belly” of a move, inevitably giving back part of their open P&L before a reversal eventually confirms the exit.
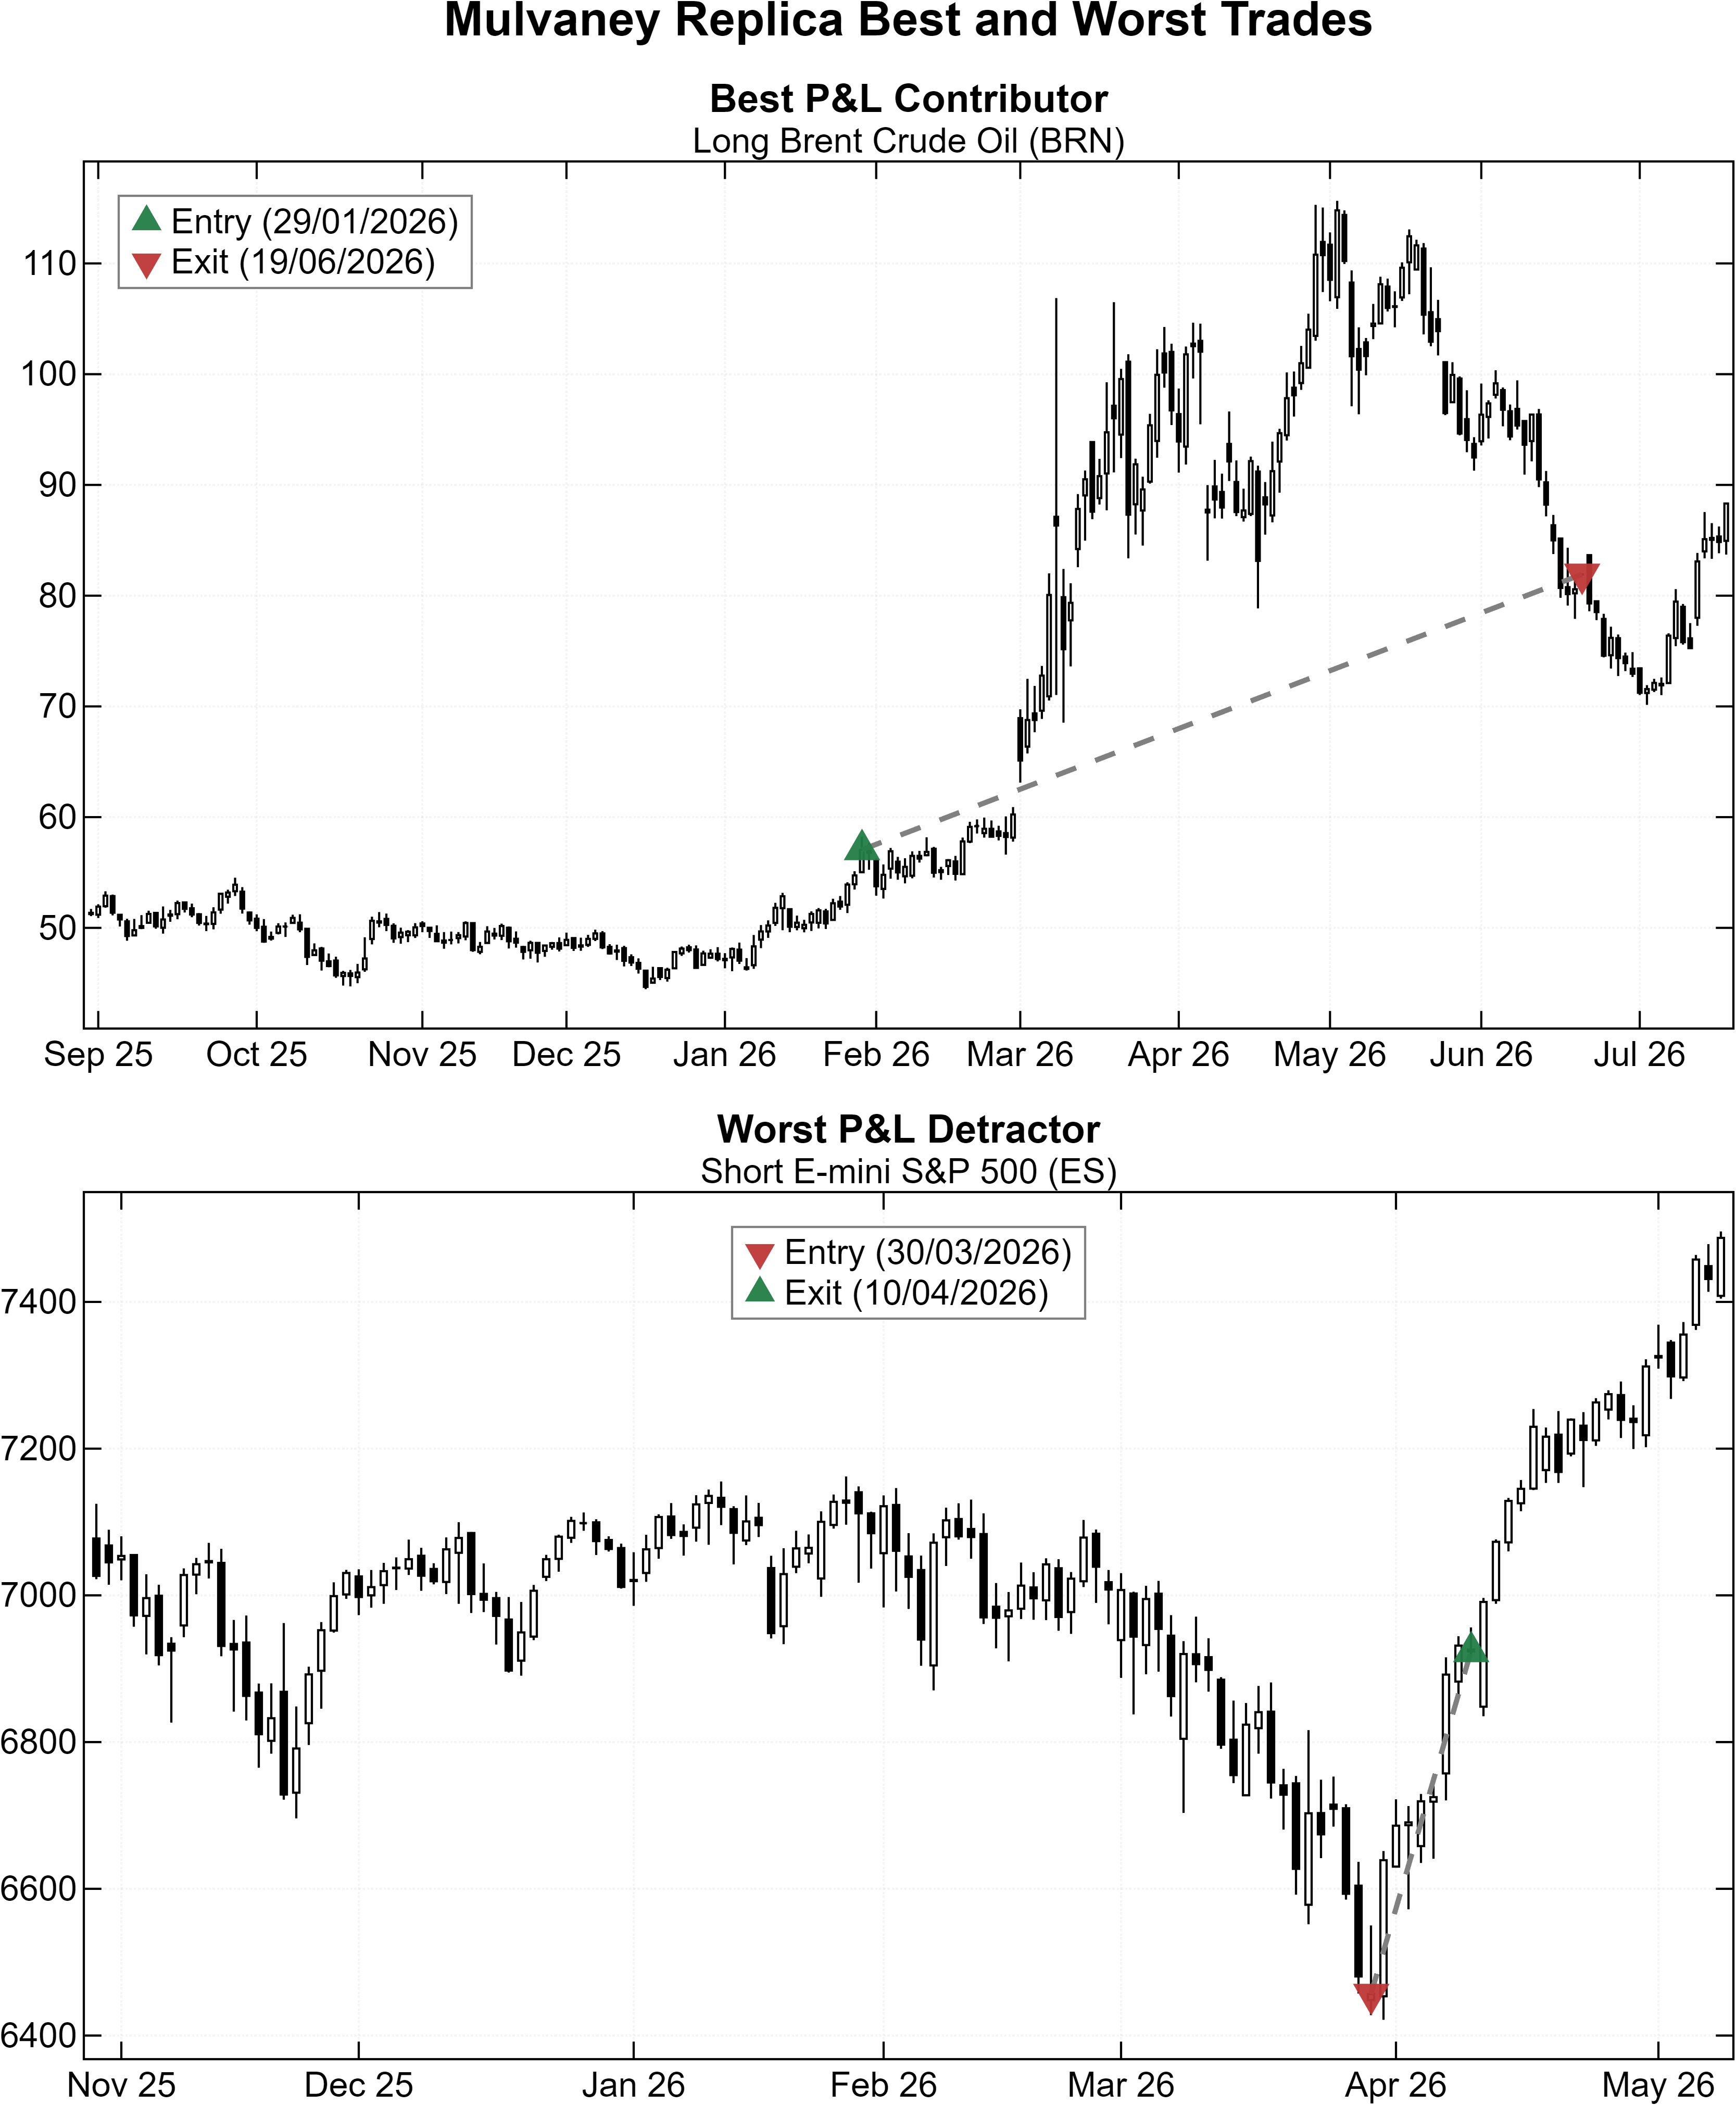
The worst P&L detractor was the second (short) tranche in E-mini S&P 500 futures. Entered on March 30, 2026, it was caught by an almost immediate rebound and exited on April 10, representing a fairly common trend-whipsaw: the signal triggered as the market broke lower, only for prices to quickly reverse and force liquidation of the position.
Interestingly, the contrast in duration between these two trades highlights one of trend following's most well-known characteristics: losers tend to be cut quickly, while winners generally need more time to develop and compound into meaningful trades.
Finally, we turn to market-level P&L to identify the instruments that contributed most and least to our replica's performance in 2026. Specifically, each market’s contribution is measured as its year-to-date P&L, expressed as a percentage of our replica AUM on the last trading day of 2025.
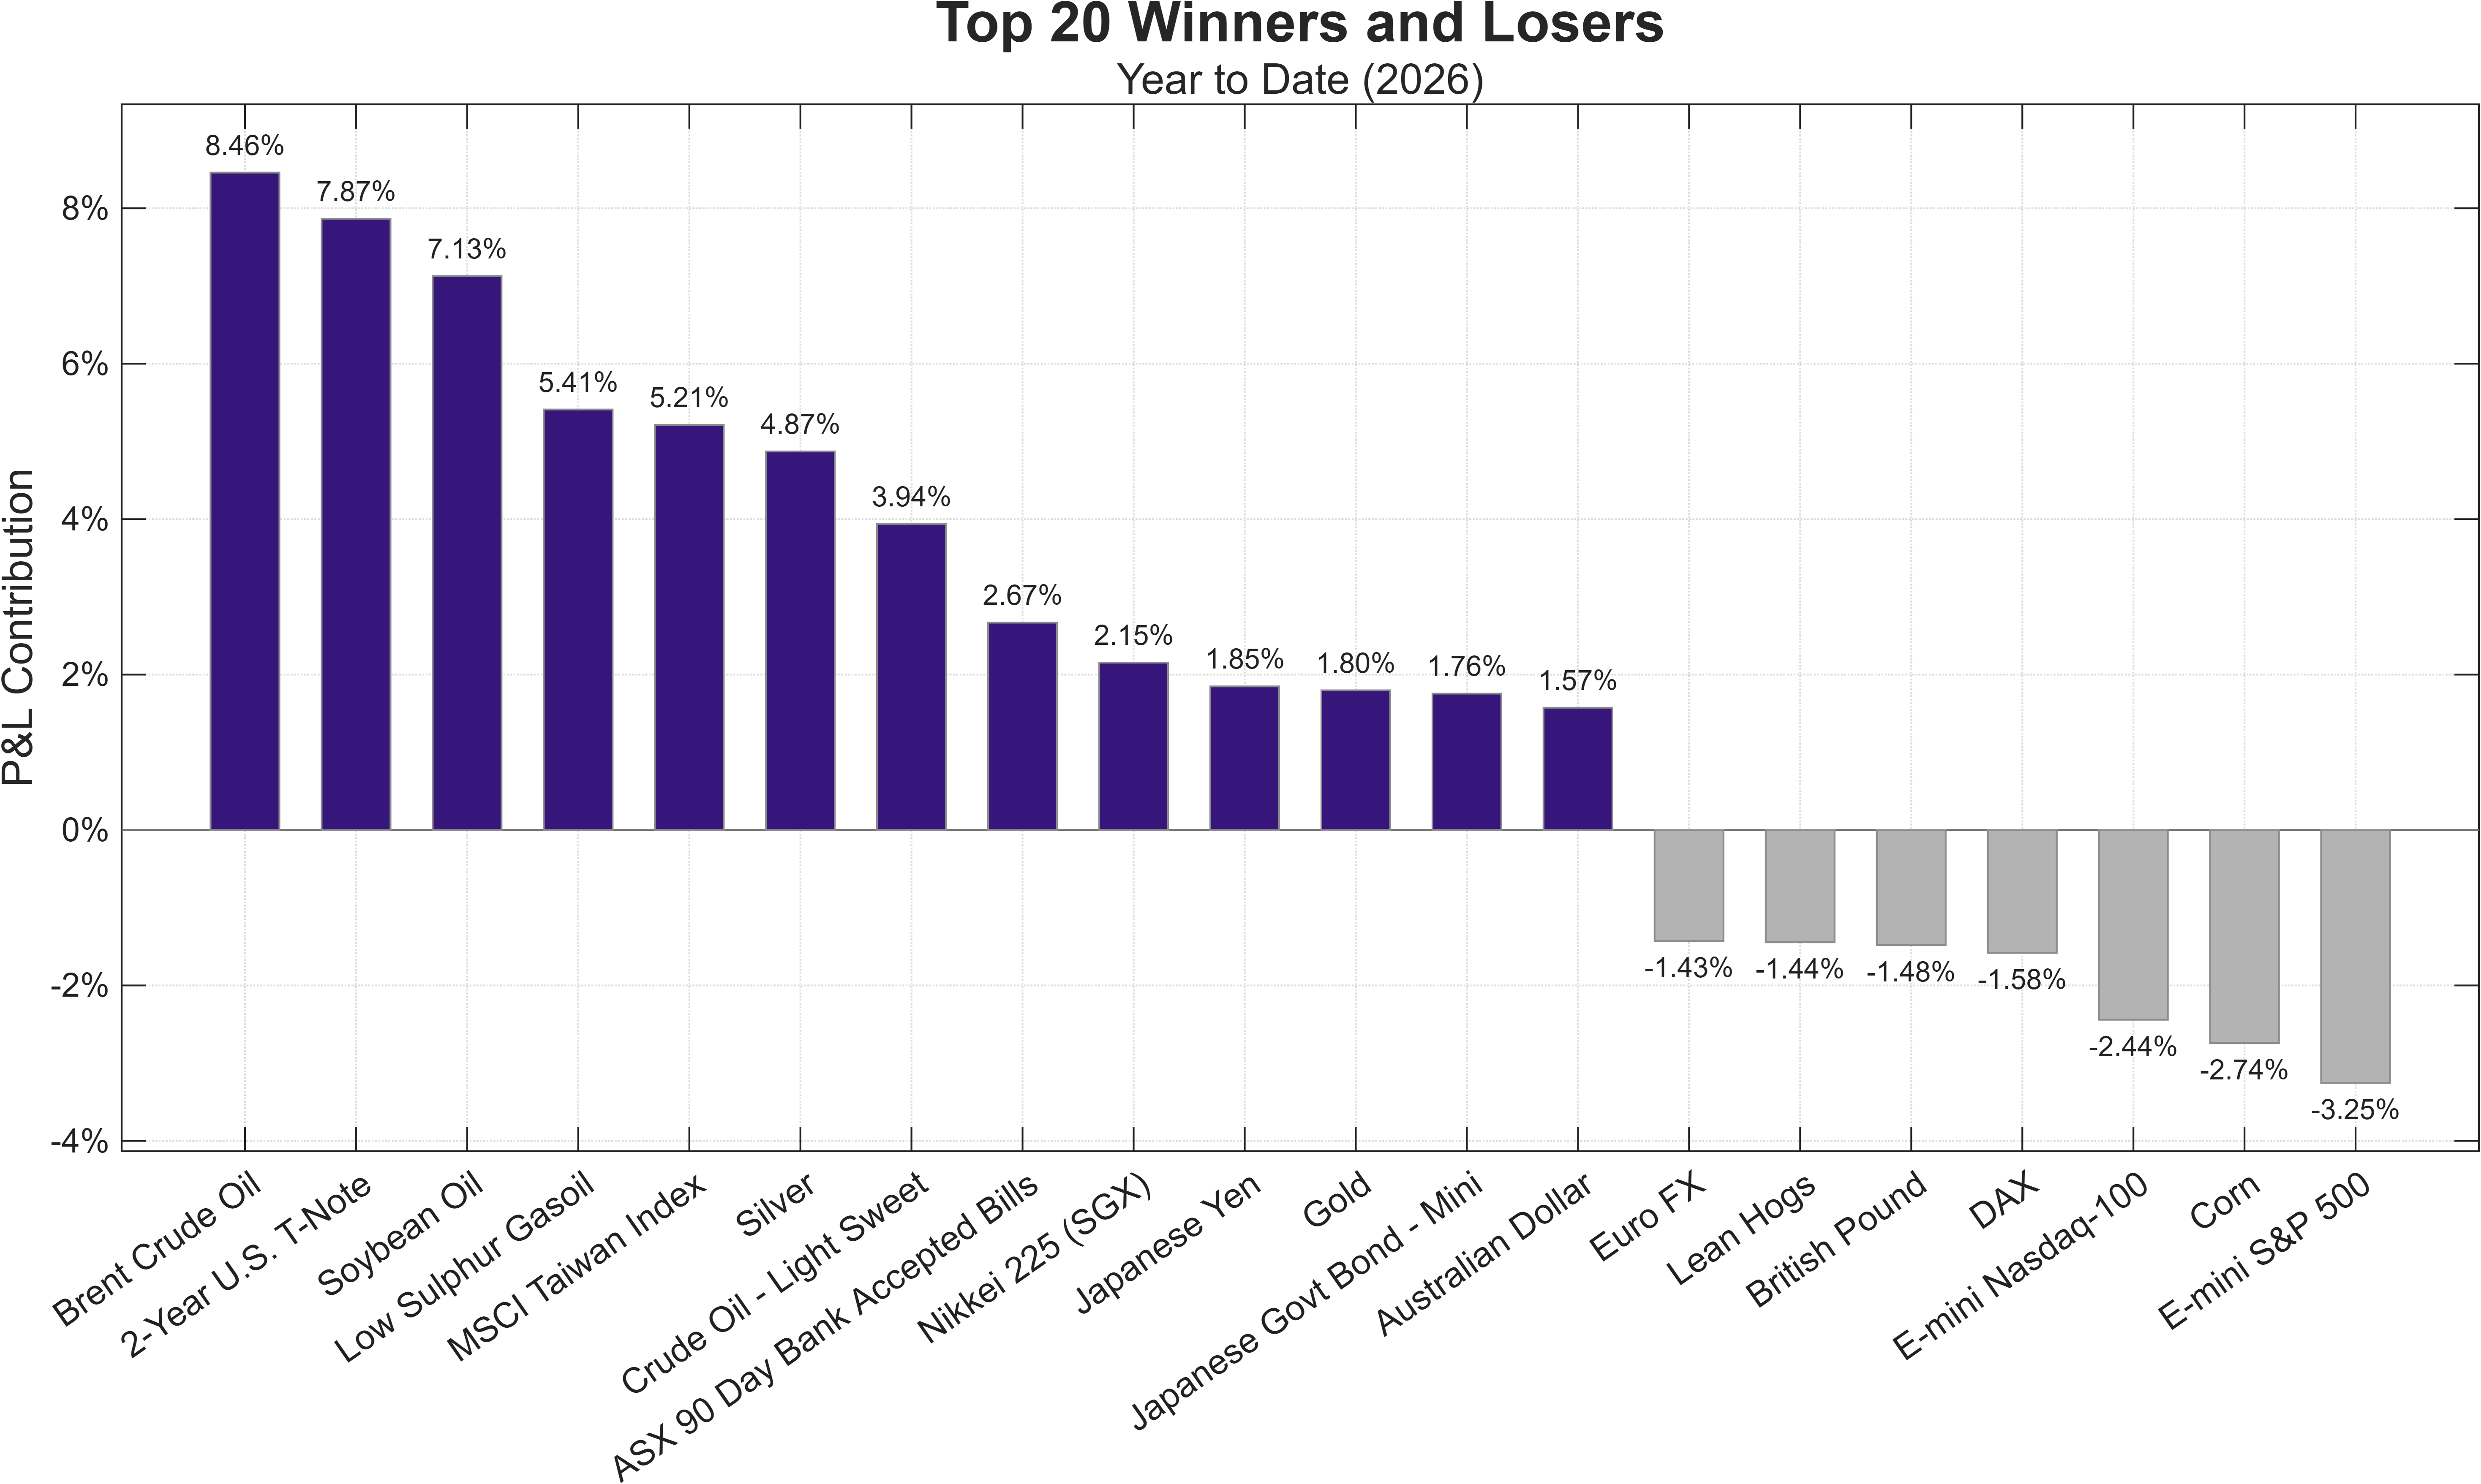
Consistent with our earlier observations, index futures were a modest source of drag this year, as short positions were caught out by equities pushing to all-time highs, with the notable exception of Asian equity markets (see MSCI Taiwan and Nikkei). The energy sector, by contrast, has been a solid contributor to P&L in 2026 so far.
Even though a degree of asymmetry between winners and losers is already visible here, it can become far more pronounced in other years. Take, for example, Cocoa (CC) in 2024, where its contribution within our replica portfolio was more than four times that of Coffee (KC), the second-largest.
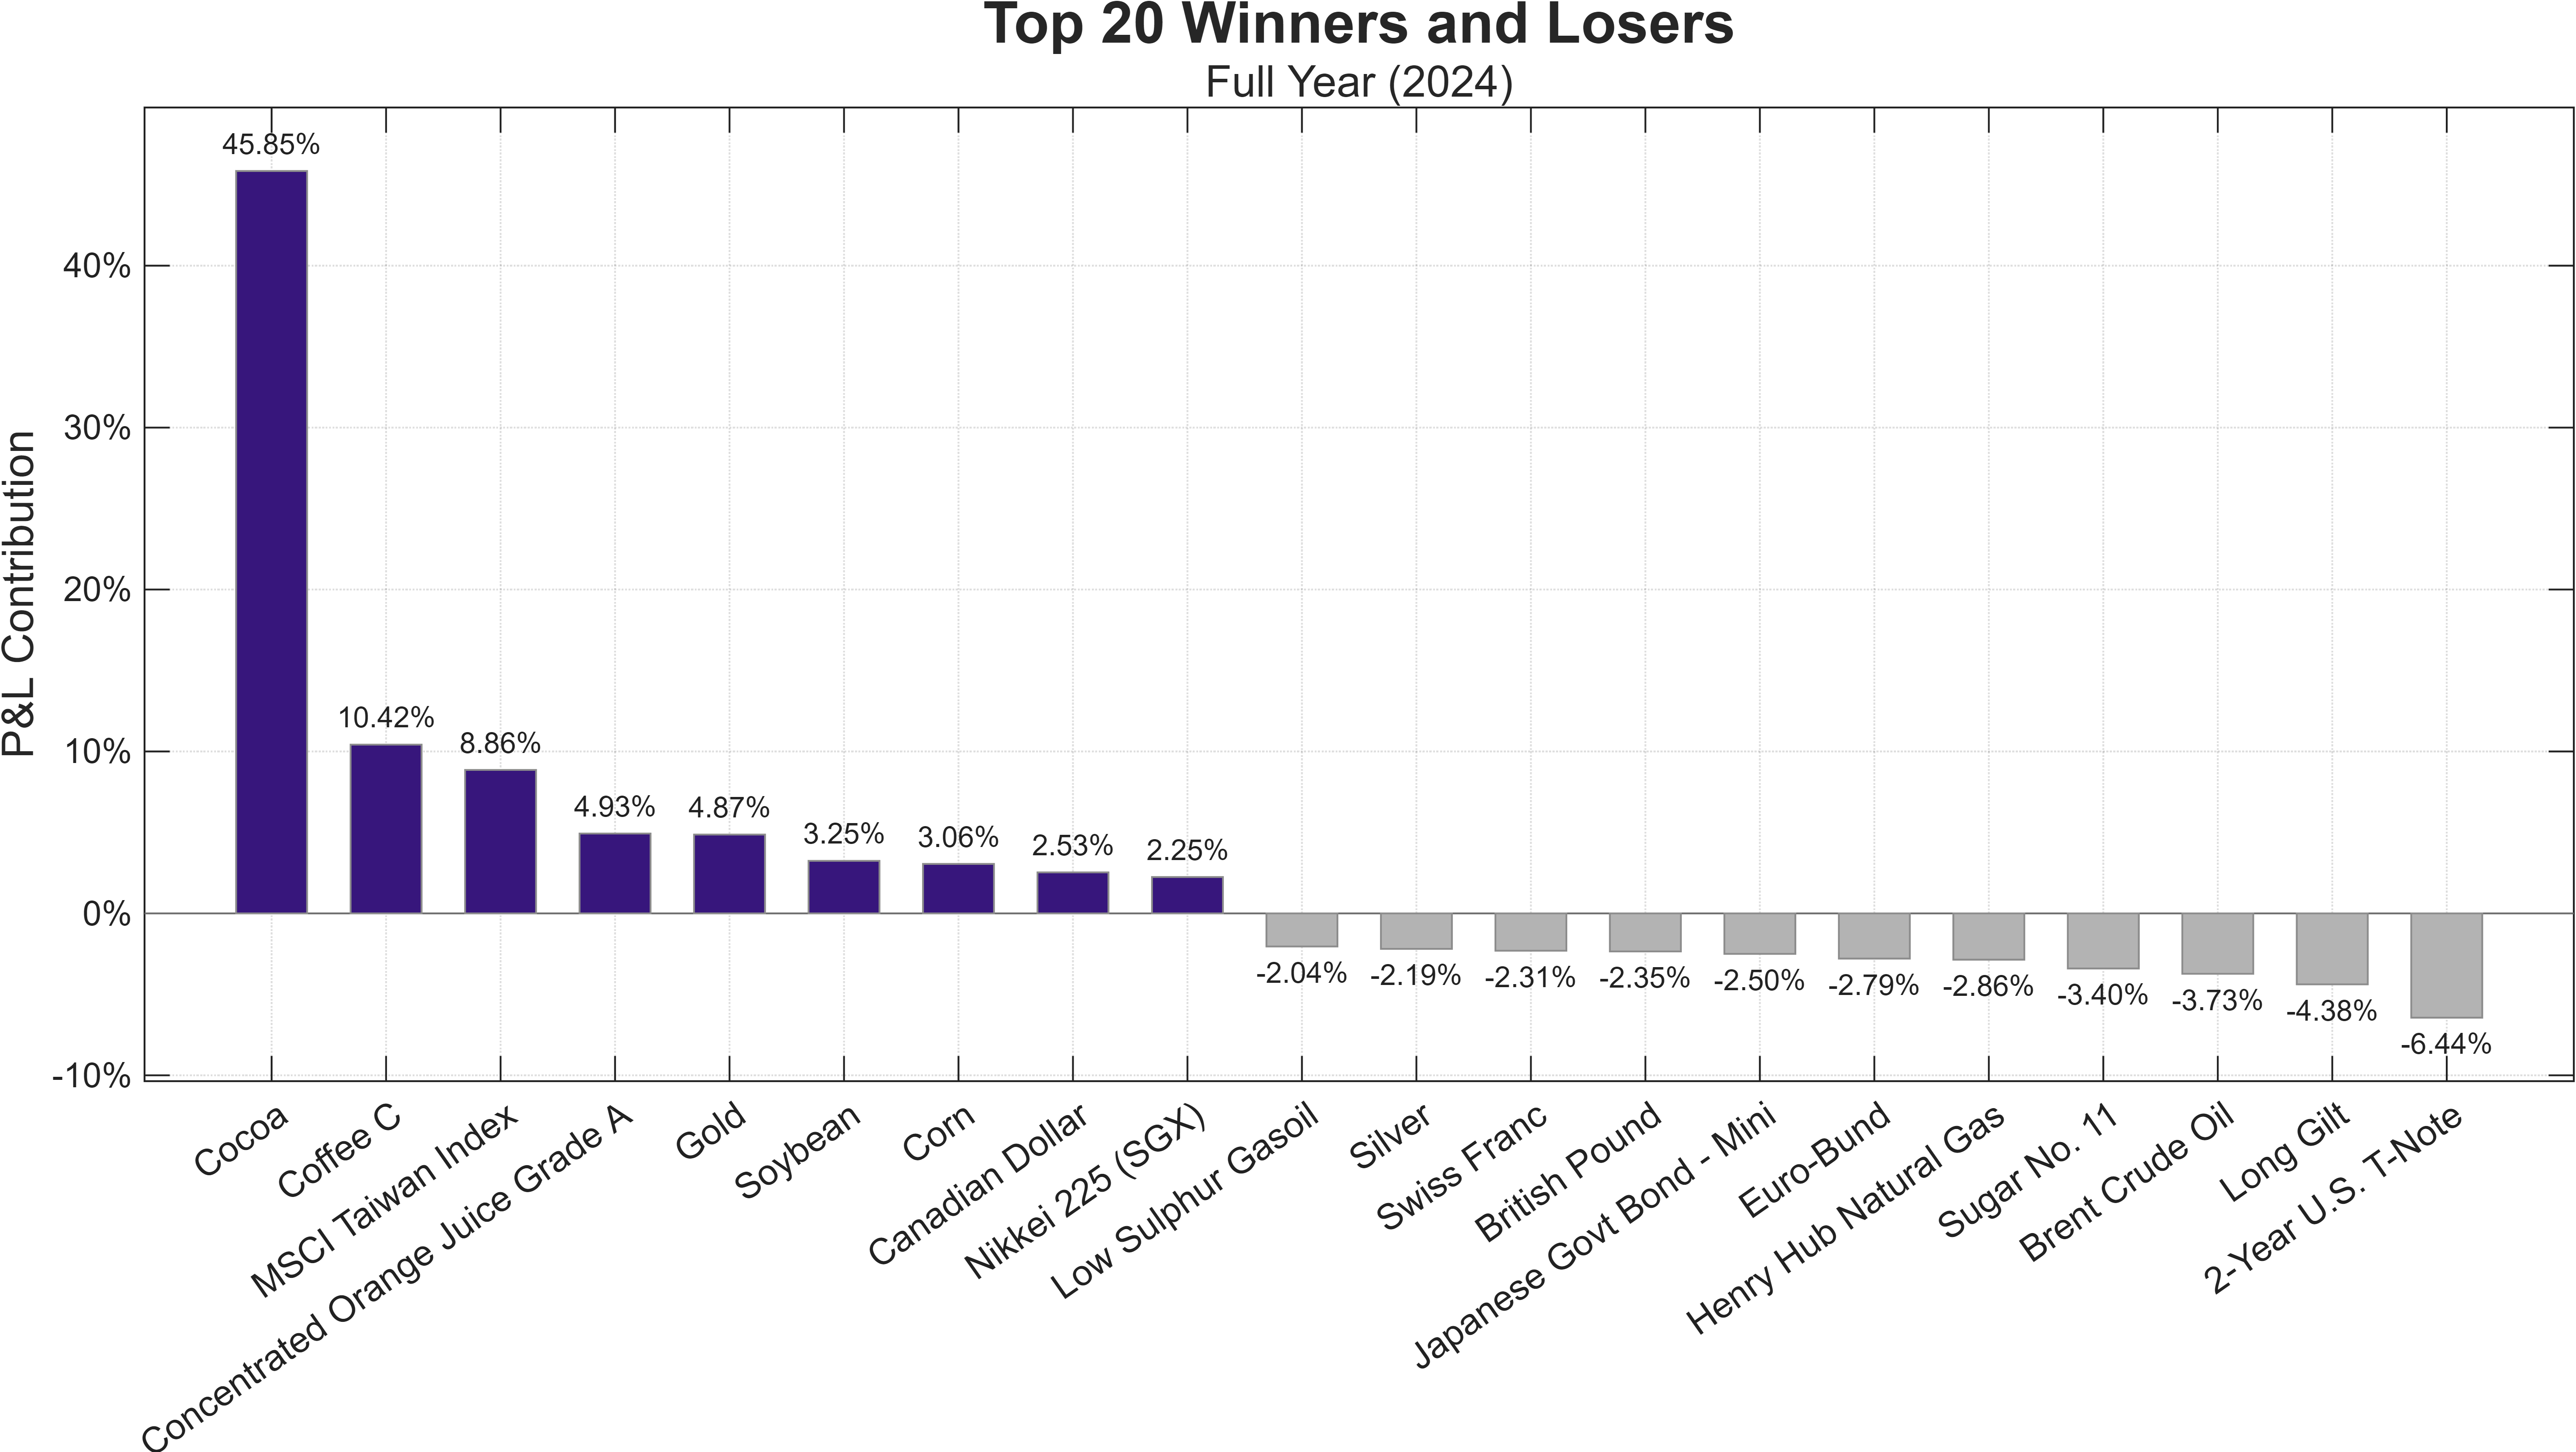
This behavior, given how Mulvaney (presumably) structures his exposures and manages ongoing positions, is somewhat expected: often referred to as “old-school” trend, it represents one of the many areas where CTA managers often hold strongly diverging views.
For additional insights into position-sizing policies applied to trend programs, we suggest reading the following article.

What Does Today’s Positioning Tell Us?
Given our replica's overall mild exposure, one might be tempted to use this information to forecast future portfolio P&L, perhaps under the assumption that lean-allocation periods tend to precede “fresh”, rewarding trends.
This would only make sense if the number of active positions, margin usage or similar proxies reliably predicted subsequent trend persistance, a premise that, to our knowledge, has never been proven.
Therefore, it is safer to assume that a lightly invested book does not imply that profitable trends are about to emerge, just as a fully invested one does not guarantee that existing positions will necessarily reverse.
As such, we advise reading current exposures as a useful benchmark against other models already in use, rather than viewing them as allocation or trend-timing signals.
Build Your Own Mulvaney Replica
As a thank-you to our readers for their continued support, we’ve put together an interactive online tool that allows readers to build and backtest their own synthetic replica of Mulvaney’s fund, along with a chance to win a one-year paid subscription to the Concretum Substack.

Our original calibration relied on ordinary least squares (OLS), a widely adopted statistical method to estimate the best-fitting relationship between two return streams, but by no means the only valid one.
This time, we encourage readers to explore an alternative goodness-of-fit approach, one based on a purely qualitative and visual assessment, which may better capture the exceptional returns of Mulvaney’s fund over the past six years.
In practice, this means comparing replicas against Mulvaney’s actual track record and favoring the specification that best captures its shape and “character,” even if it isn’t the statistically optimal one.
To Be Eligible
To be eligible to win a one-year membership to our Substack publication, make sure to subscribe with a valid email address and restack this article.
To Participate
Experiment with the tool, adjusting the parameters until you land on the specification you visually prefer.
Hit submit, and enter the email address you used to subscribe to our Substack page.
You can submit as many specifications as you like, so feel free to try out several combinations to improve your odds.
The Concretum team will review all submissions and contact the winner by email on September 1st, 2026.
As always, thank you for reading, we look forward to seeing what you build, and to hearing your thoughts in the comments.
If you found this article useful, we’d love to hear from you: let us know if you run trend-following strategies, and whether your current positioning looks consistent with our Mulvaney replica or takes a different view.

Research Transparency Statement
Every research idea, hypothesis, methodology, dataset, code, backtest, analysis, and conclusion presented in this article was independently developed by the Concretum Group research team. Artificial intelligence tools were used as productivity assistants to support the preparation of the final manuscript, including language refinement, grammatical review, and, where appropriate, the creation of tables, figures, and other visual elements. All research decisions, analyses, interpretations, and conclusions remain entirely those of the authors.
Disclaimer
This publication is provided by Concretum Group for informational, educational, and research purposes only. It does not constitute investment, financial, legal, or tax advice, nor a recommendation to buy or sell any security, instrument, strategy, or investment product. All investments involve risk, including possible loss of principal. Past performance, backtested performance, and historical analysis are not reliable indicators of future results. Readers should conduct their own research and consult qualified professionals before making investment decisions.
Full disclaimer: https://concretumgroup.com/disclaimer/