

Python and MATLAB Backtesting Tutorials for Quantitative Traders
Python and MATLAB notebooks for the strategies behind our research papers

These Python and MATLAB backtesting tutorials show how we implement the strategies behind our published quantitative research papers. Each notebook is designed to help readers reproduce the core logic, experiment with parameters, and understand the research using freely available datasets whenever possible.
We often get asked how we backtest, or how someone outside our team can reproduce the kind of studies we publish. Those questions are fair. A paper without a path to replication is harder to trust, and harder to learn from.
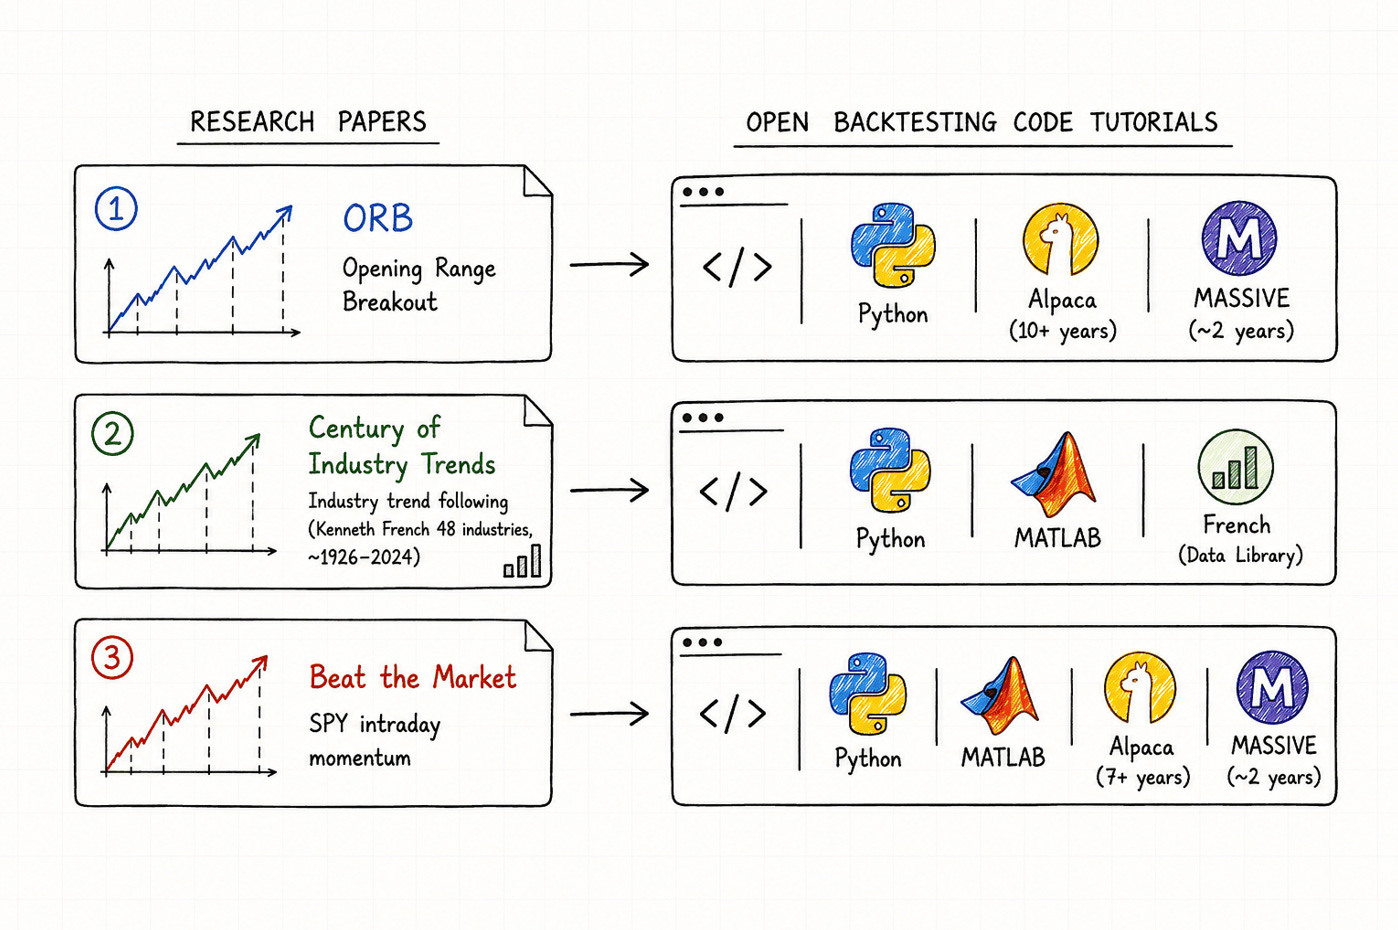
Over the past few years we have published a set of coding tutorials that open up parts of that process. They cover the strategies behind several of our research papers, in both Python and MATLAB, using freely available data where possible: Kenneth French industry portfolios, Alpaca for multi-year free intraday US equity data, and Massive.com (formerly Polygon.io) for free-tier intraday history.
These notebooks are not exact replicas of our internal research stack. We simplify where we can. We translate the core logic so that readers can run it, read it, and experiment with it. The goal is transparency and accessibility, not a one-to-one dump of production code.
Most of the Python notebooks can be run directly in the cloud with Google Colab for free. No local install required. The MATLAB versions need MATLAB.
What These Notebooks Are (and Are Not)
They are educational, research-oriented implementations of the strategies described in our papers.
They are intentionally written to be readable. Across these posts we deliberately avoid more complex coding patterns that might improve computational efficiency but would make the logic harder to follow for someone learning quantitative research.
They are close to what we do in spirit (entries, exits, risk rules, and the broad shape of the data pipeline), but they are not identical to our internal research stack. One of the biggest gaps is data quality.
In Can You Trust Your Intraday Database?, we showed that running the same ORB backtest, with identical code, parameters, and dates, across Massive, Alpaca, IQFeed, Interactive Brokers, and later Databento, produced materially different results. Under H/L stops, final portfolio values ranged from roughly $226k to $726k: more than a threefold gap from data differences alone. The strategy was not the main source of divergence. The data was.

That study documented the structural problems we keep seeing in 1-minute OHLCV feeds:
phantom highs and lows
stale bars
early-close leakage
tick-to-bar assignment differences
venue coverage and trade aggregation differences
The practical follow-up is How to Detect and Fix Problems in Intraday Market Data, where we open-sourced concretum_tests, a lightweight Python CLI we use internally to audit 1-minute CSVs. It checks early-close leakage, phantom highs/lows, strong stale bars, and missing bars. Where a fix is defensible, it can clean early-close leakage and optionally reconstruct phantom wicks. It does not invent missing bars, because fabricating fills can create trades that never existed.

That data layer is part of how we work. It is still only one piece of the internal process behind the research. There are other steps we use in practice that are not in these notebooks either. Some of that may appear in future posts if we can simplify it enough to share cleanly.

1. Can Day Trading Really Be Profitable?
Paper: Can Day Trading Really Be Profitable? (Zarattini & Aziz, 2023)
This line of code implements the Opening Range Breakout (ORB) strategy from the paper: define a short opening range, take direction from that range, enter on the next bar, manage risk with stops, and hold to stop or the close.
We published two Python versions so readers can choose based on data access.
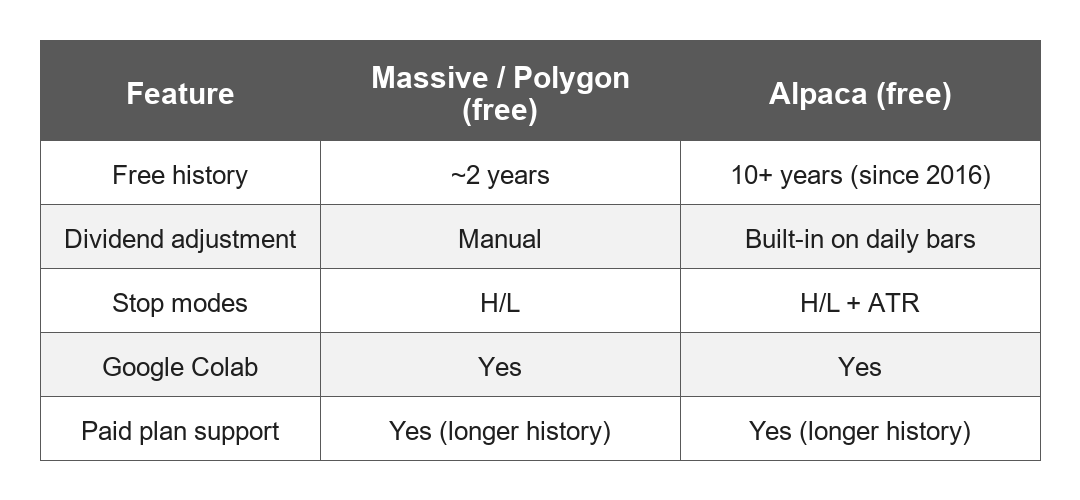
Python + Alpaca: 10+ years of free SIP intraday data
Runs in Google Colab
Free Alpaca SIP 1-minute history back to 2016
Includes both High/Low and ATR stop modes
Handles adjustments and early-close filtering more cleanly than the earlier free-tier Polygon workflow
This is the version we recommend if you want a long free history without a paid data subscription.
Python + Massive.com (formerly Polygon.io): ~2 years on the free tier
Runs in Google Colab
Free Massive / Polygon history is limited to roughly the last two years
Same core ORB logic; useful if you already have a Polygon/Massive key
2. A Century of Profitable Industry Trends
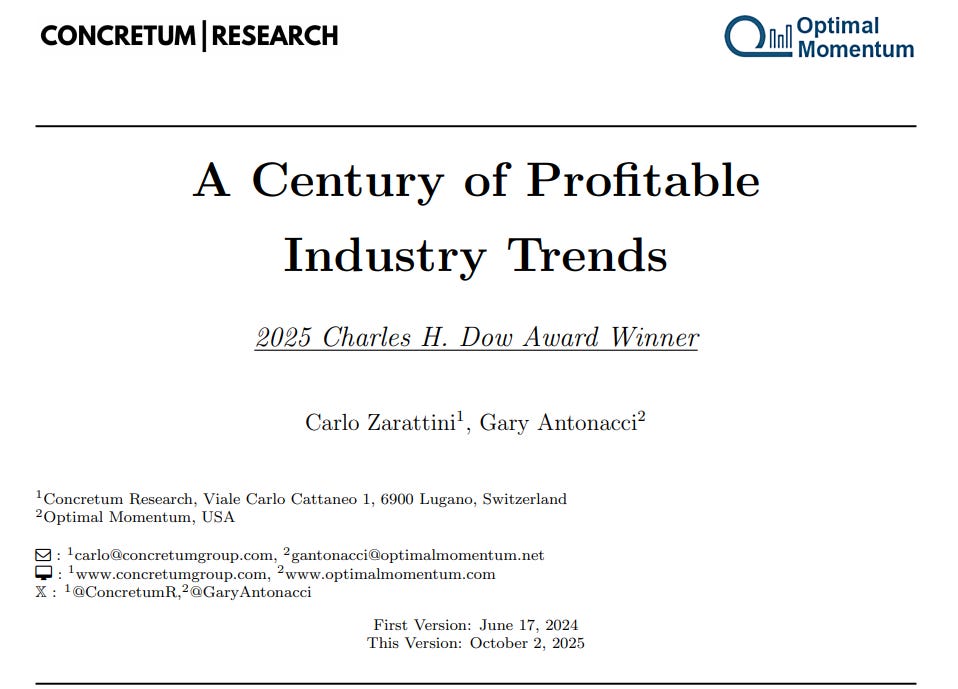
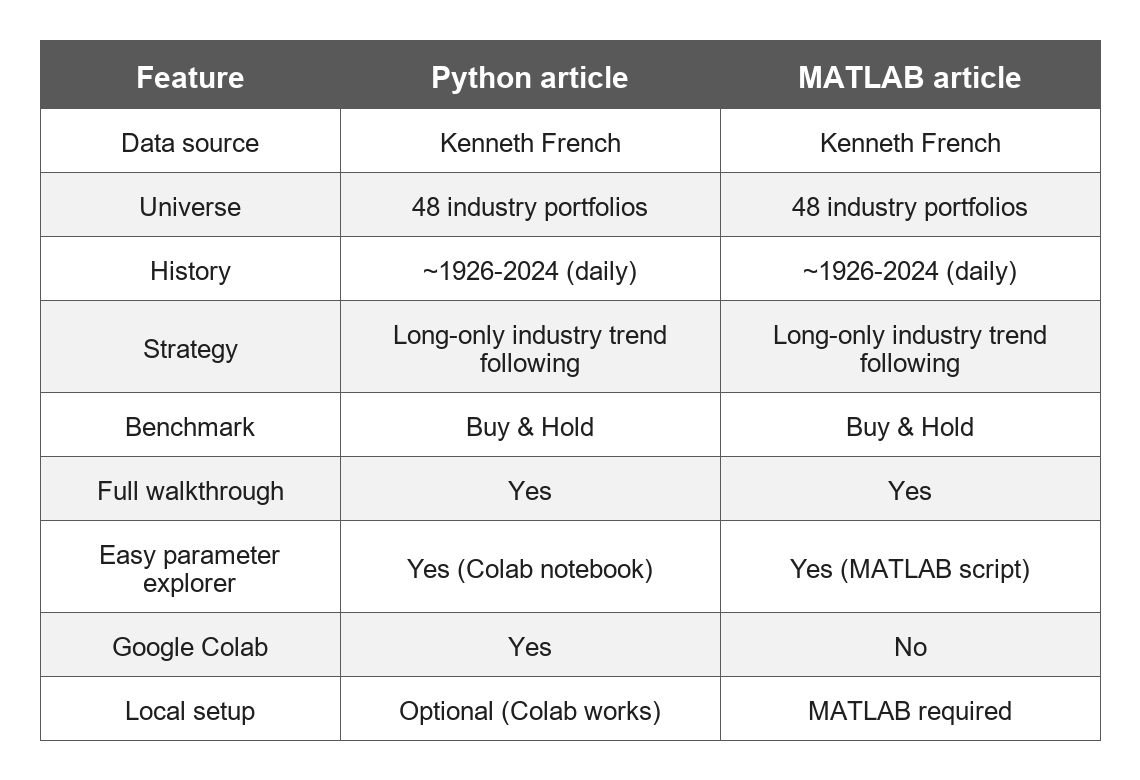
This study builds a long-only, industry-based trend-following portfolio using Kenneth French‘s freely available daily data for 48 industry portfolios, covering roughly 1926-2024. The open code compares the momentum portfolio against a passive buy-and-hold benchmark. Strategy parameters were not optimized in-sample.
Python: Kenneth French data
Runs in Google Colab
Downloads French industry and factor files directly
Includes a full walkthrough notebook and a lighter “easy parameter” notebook for quick experiments
MATLAB: Kenneth French data
Same research design in MATLAB
Includes a parameter-exploration script so readers can see how lookbacks and related choices affect profitability
Requires MATLAB (not Colab)
3. Beat the Market: SPY Intraday Momentum
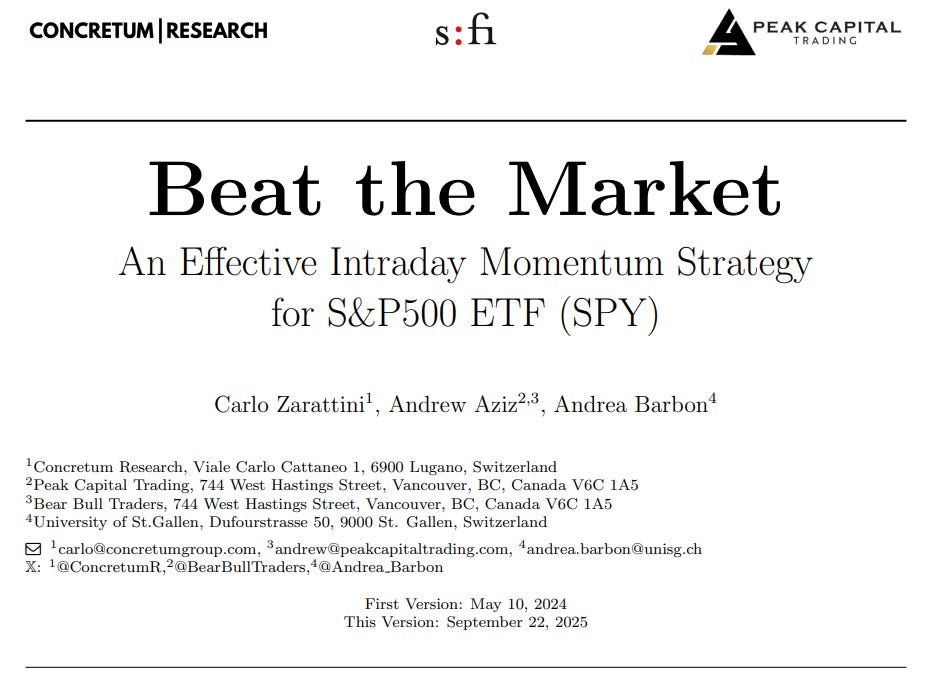
This family of notebooks backtests the SPY intraday momentum framework from the paper: VWAP, open-relative moves, volatility scaling, and the related execution rules, first in MATLAB, then in Python.
MATLAB + Massive.com / Polygon.io: ~2 years free data
Original MATLAB path used to study the paper strategy
Free Massive / Polygon history limited to roughly two years
Requires MATLAB
Python + Massive.com / Polygon.io: ~2 years free data
Python translation of the MATLAB logic
Same free-tier data window
Runs in Google Colab
Python + Alpaca: 7+ years free intraday data, plus overnight gap reversal
Extends the history to over seven years of free Alpaca intraday data
Keeps the paper’s intraday momentum edge
Adds an overnight gap-reversal component (large overnight moves that tend to mean-revert in the first part of the session)
Runs in Google Colab
This is the version to start with if you want longer free SPY history and the gap enhancement on top of the original paper logic.
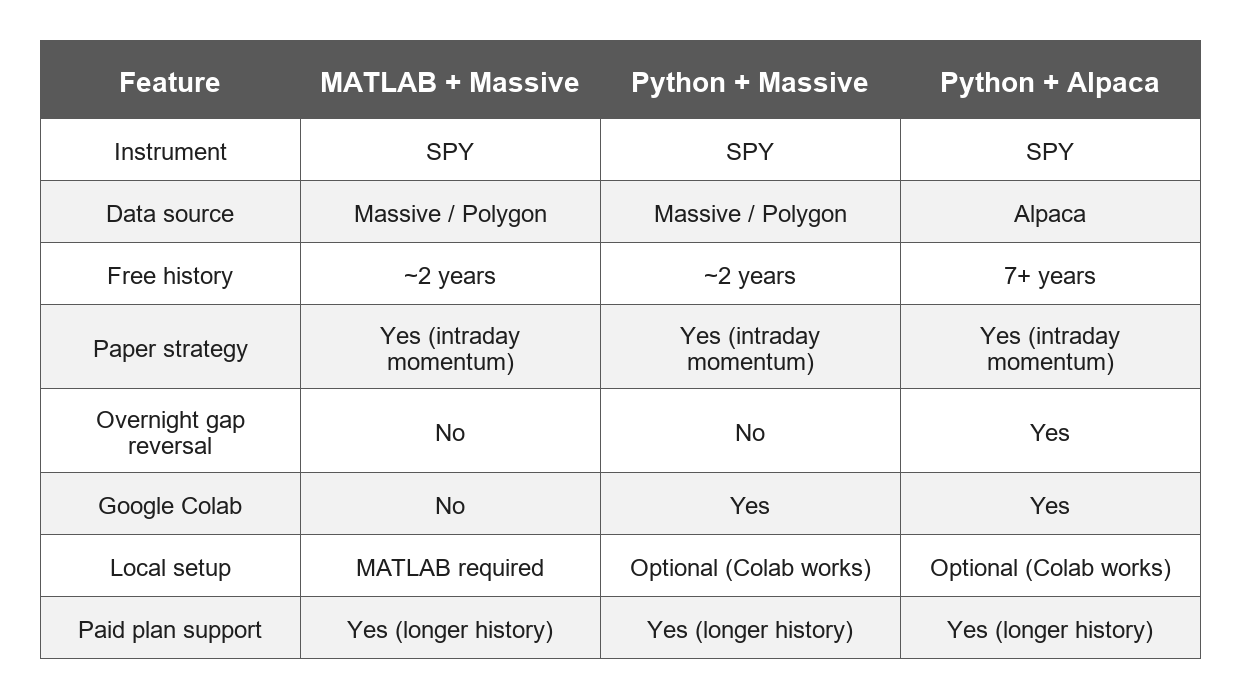
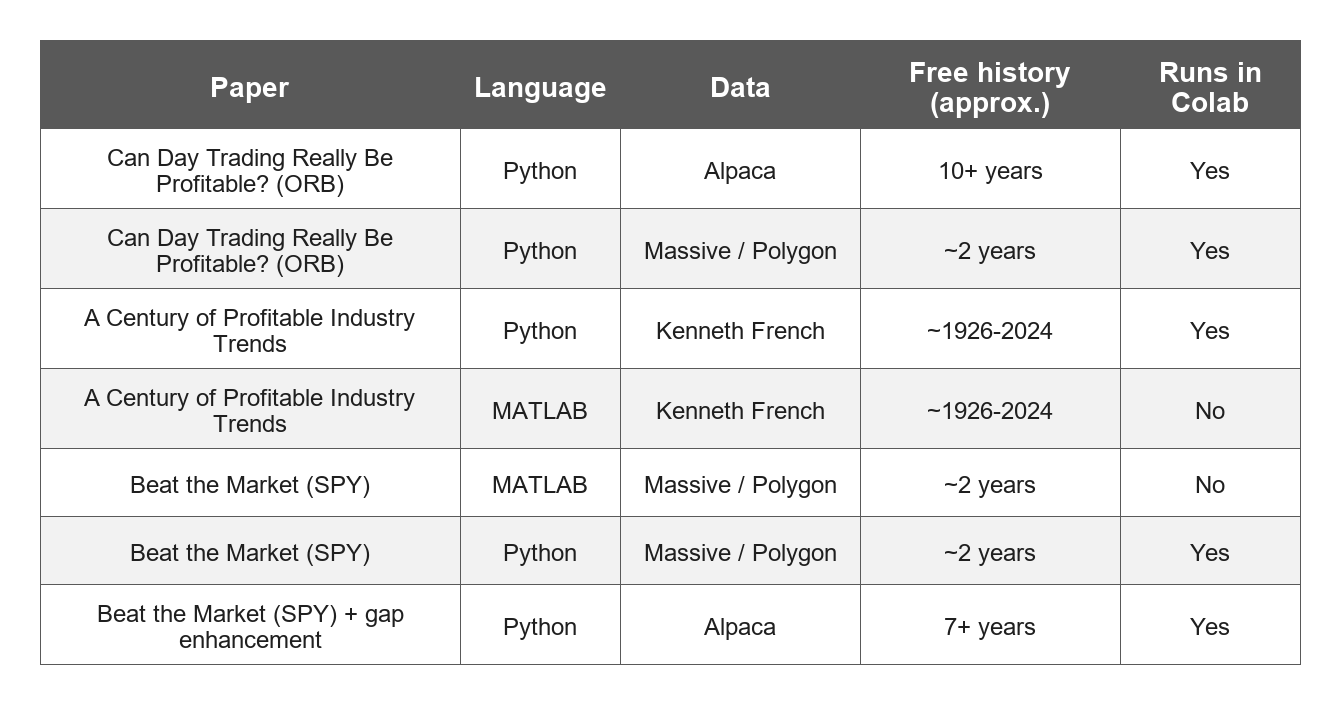
Quick Reference
How to Use These
Read the paper first so the strategy rules are clear.
Open the matching coding article.
For Python posts, launch the Google Colab notebook, add any required free API keys (Alpaca or Massive/Polygon), and run all cells.
For MATLAB posts, paste the scripts into MATLAB and set your API key where needed.
Change parameters only after you understand the baseline. The published notebooks are meant as transparent starting points, not optimized production systems.
If you're working with free intraday US equity data, Alpaca currently offers a much longer free SIP history than Massive / Polygon, whose free tier has historically been limited to roughly two years. For the century-long industry trend study, the notebooks use the Kenneth French Data Library.

We publish research because we care about evidence. We publish code because questions about how the evidence was produced deserve a concrete answer.
These notebooks will not replace a full institutional research stack. They will get you much closer to the logic behind our papers than a PDF alone can. Run them, break them, change the ticker, change the lookback, and see what holds up.
If you found this article useful, feel free to leave a comment or contact us by direct message or at info@concretumgroup.com.

Disclaimer
This publication is provided by Concretum Group for informational, educational, and research purposes only. It does not constitute investment, financial, legal, or tax advice, nor a recommendation to buy or sell any security, instrument, strategy, or investment product. All investments involve risk, including possible loss of principal. Past performance, backtested performance, and historical analysis are not reliable indicators of future results. Readers should conduct their own research and consult qualified professionals before making investment decisions.
Full disclaimer: https://concretumgroup.com/disclaimer/
Research Transparency Statement
Every research idea, hypothesis, methodology, dataset, code, backtest, analysis, and conclusion presented in this article was independently developed by the Concretum Group research team. Artificial intelligence tools were used as productivity assistants to support the preparation of the final manuscript, including language refinement, grammatical review, and, where appropriate, the creation of tables, figures, and other visual elements. All research decisions, analyses, interpretations, and conclusions remain entirely those of the authors.