


Last week, we shared some findings of an intraday short-selling signal taken from our internal research archives. Today, picking up on the same theme, we present some evidence behind an effect we believe stems from the very presence of short sellers in stocks with the same characteristics highlighted in our previous piece.
We recommend you first read our original analysis here.

We like to refer to this phenomenon as the short-seller flow effect, and given the positive reception of last week’s article, this felt like a natural follow-up.
To Borrow or Not to Borrow?
One of the toughest obstacles practitioners face when short-selling individual names (and one we have repeatedly encountered in live tests as well) is simply being able to borrow shares in the first place.
When locates are available at all (which is far from guaranteed), their fees can be punishing and significantly erode whatever edge the signal carries: as capital committed to this type of strategy grows, the borrow problem only gets more painful.
But constraints can sometimes be a useful prompt for creative thinking, and the signal we present today is, in fact, rooted in one we initially saw as a dead end.
The Signal
We decided to investigate long-side opportunities in the same ticker that our original signal would flag as promising candidates to fade.
More specifically, the strategy buys stocks at the closing auction using market-on-close (MOC) orders and liquidates them at the following session’s open using market-on-open (MOO) orders, thereby isolating the overnight return component.
Ironically, the very characteristics that make these stocks attractive short candidates intraday may also create the conditions for persistent overnight rebounds.
The stock selection steps remain identical to those described in our original piece, with only the buy/sell rules changing: full details, as always, are disclosed at the end of the article.
Positions are sized at a fixed 10% portfolio weight: this means that, on days when fewer than 10 stocks are identified by our criteria, the portfolio will also be less than 100% invested.
The gross-of-costs results are displayed in the plot below.
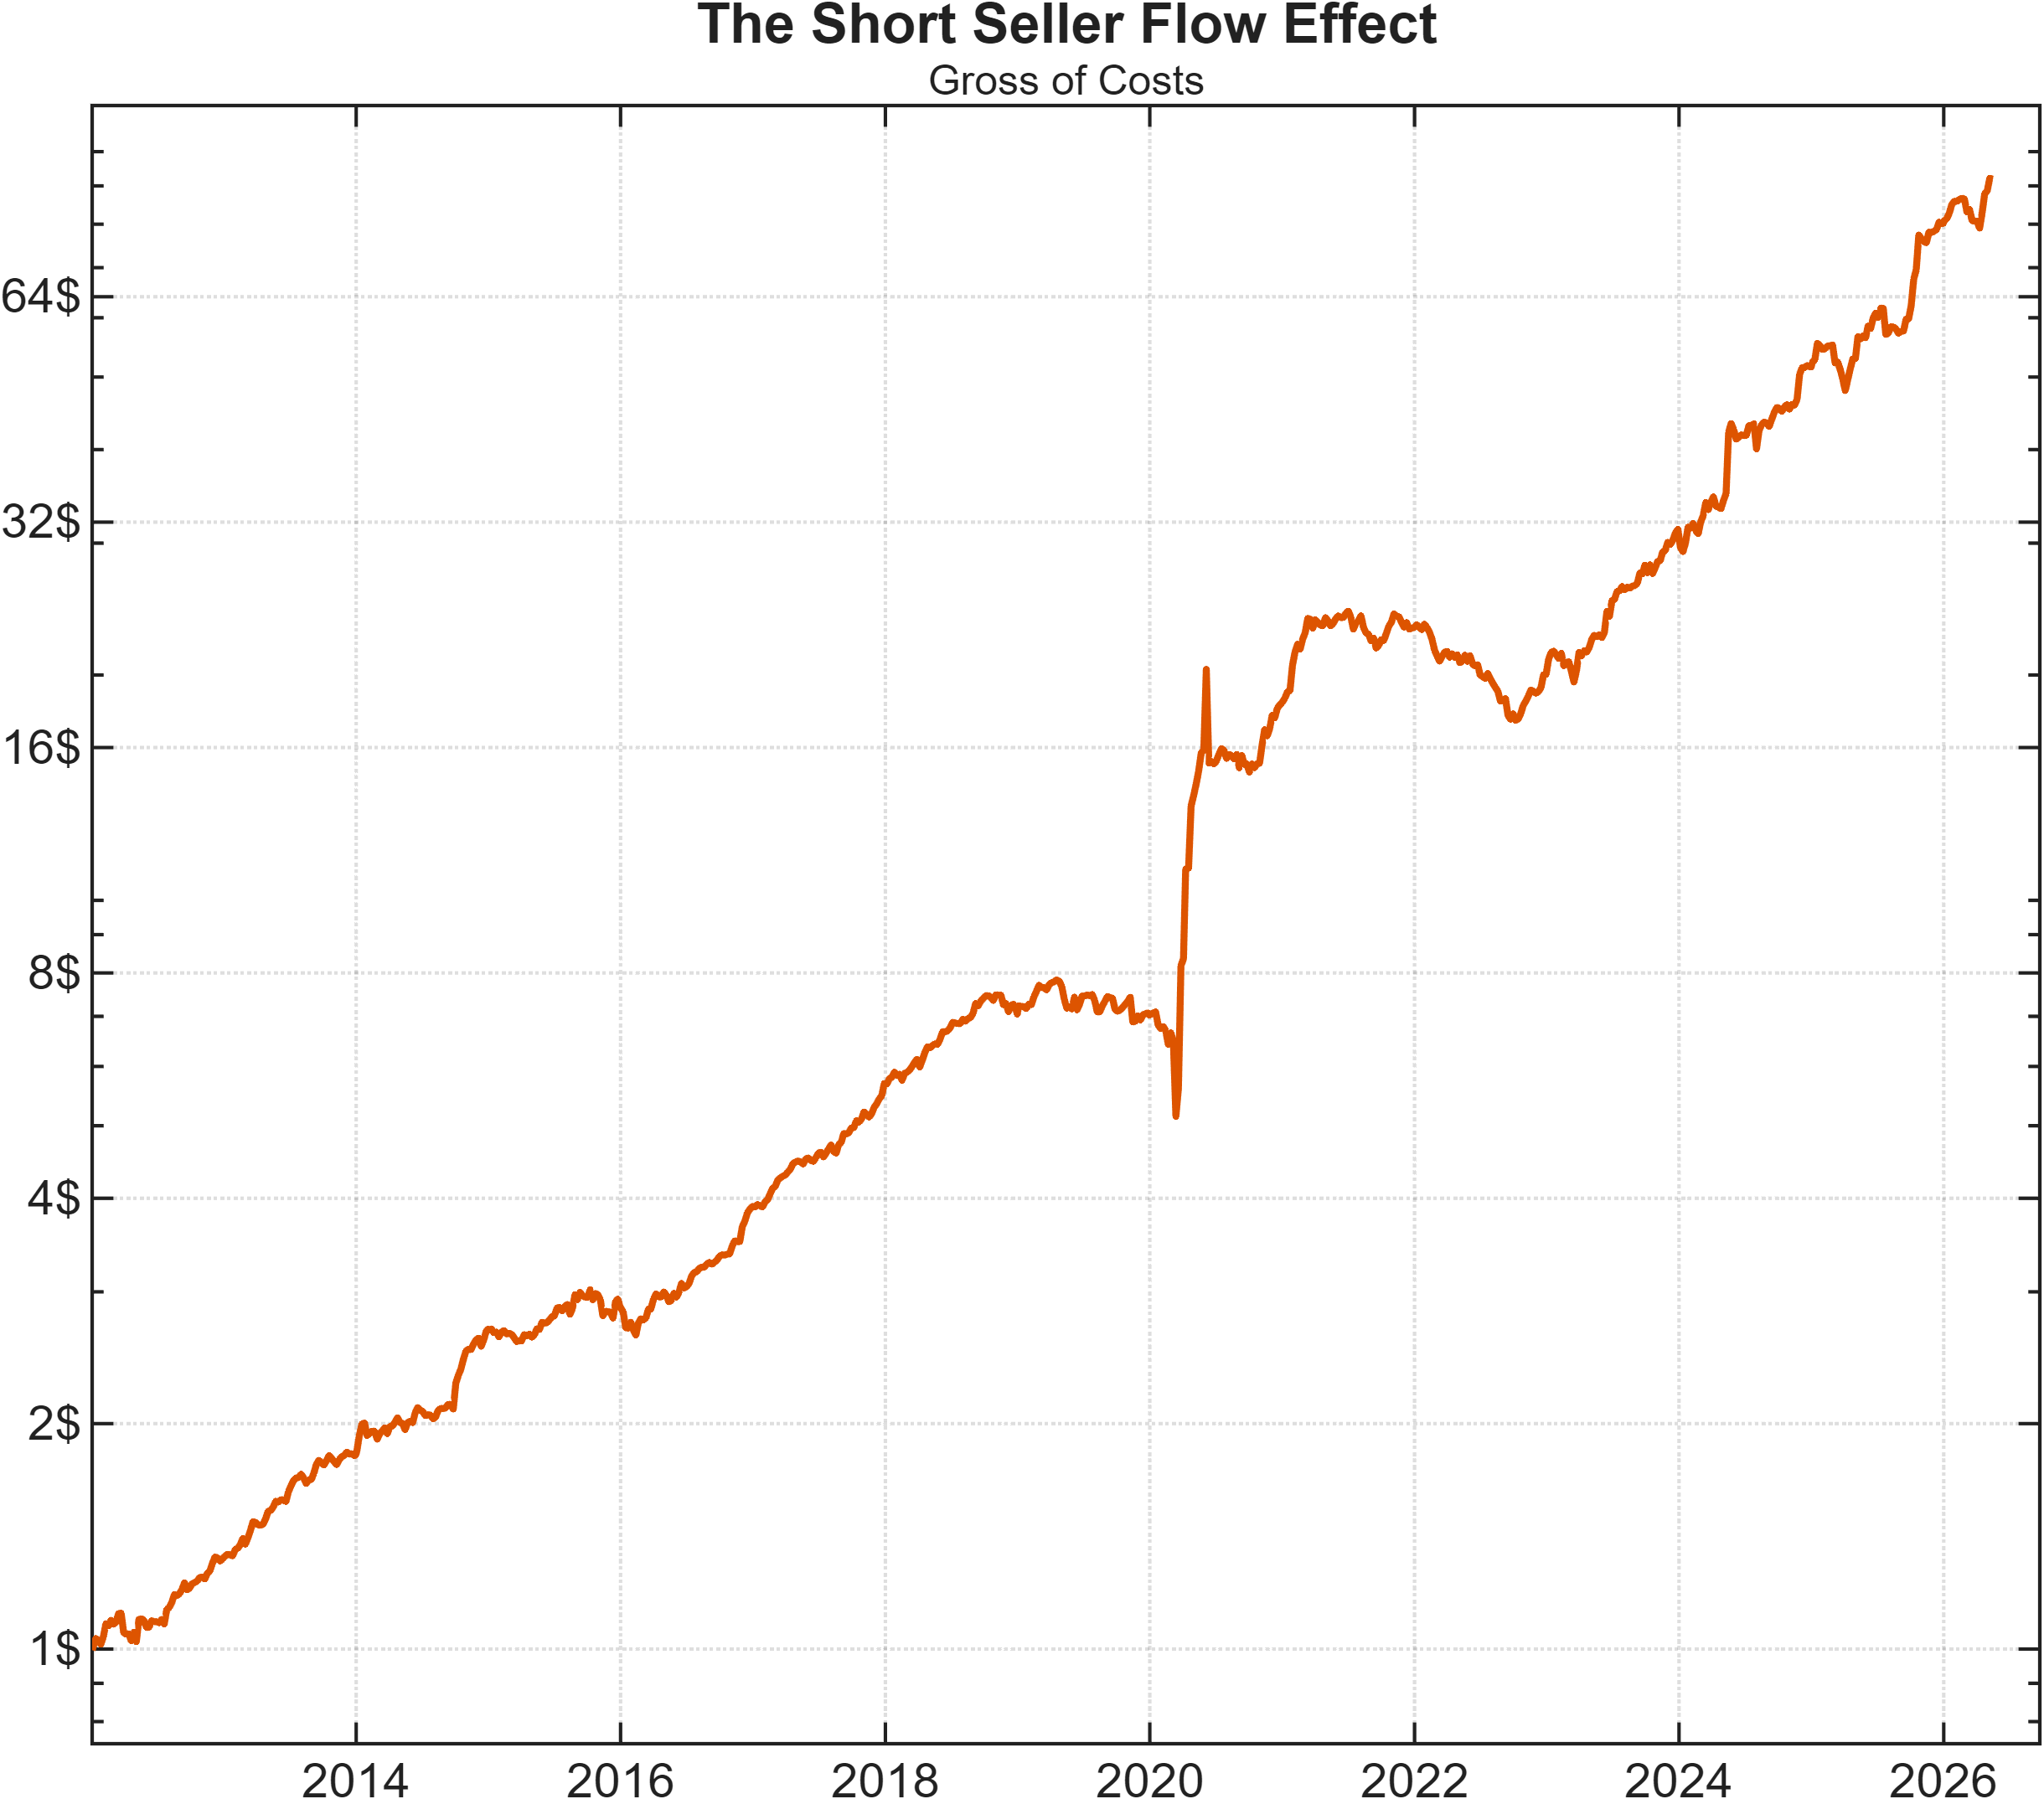
Within our backtested sample (2012–2026), we report a CAGR of 37.1%, a Sharpe ratio of ~1.6, and a maximum drawdown around 35%: notably, unlike the original variant, the equity curve shows no signs of structural breaks in recent years.
This signal lends itself to being traded via market-on-close (MOC) and market-on-open (MOO) orders, which minimise slippage by allowing investors to participate directly in the closing and opening auctions of each session.
Considering that this time there are no locate fees to pay, and that the average P&L per share stands at ~$0.042 (against standard-tier IBKR commissions of $0.0035 per share), we can say that the gross-of-cost picture is encouraging enough to justify further work.
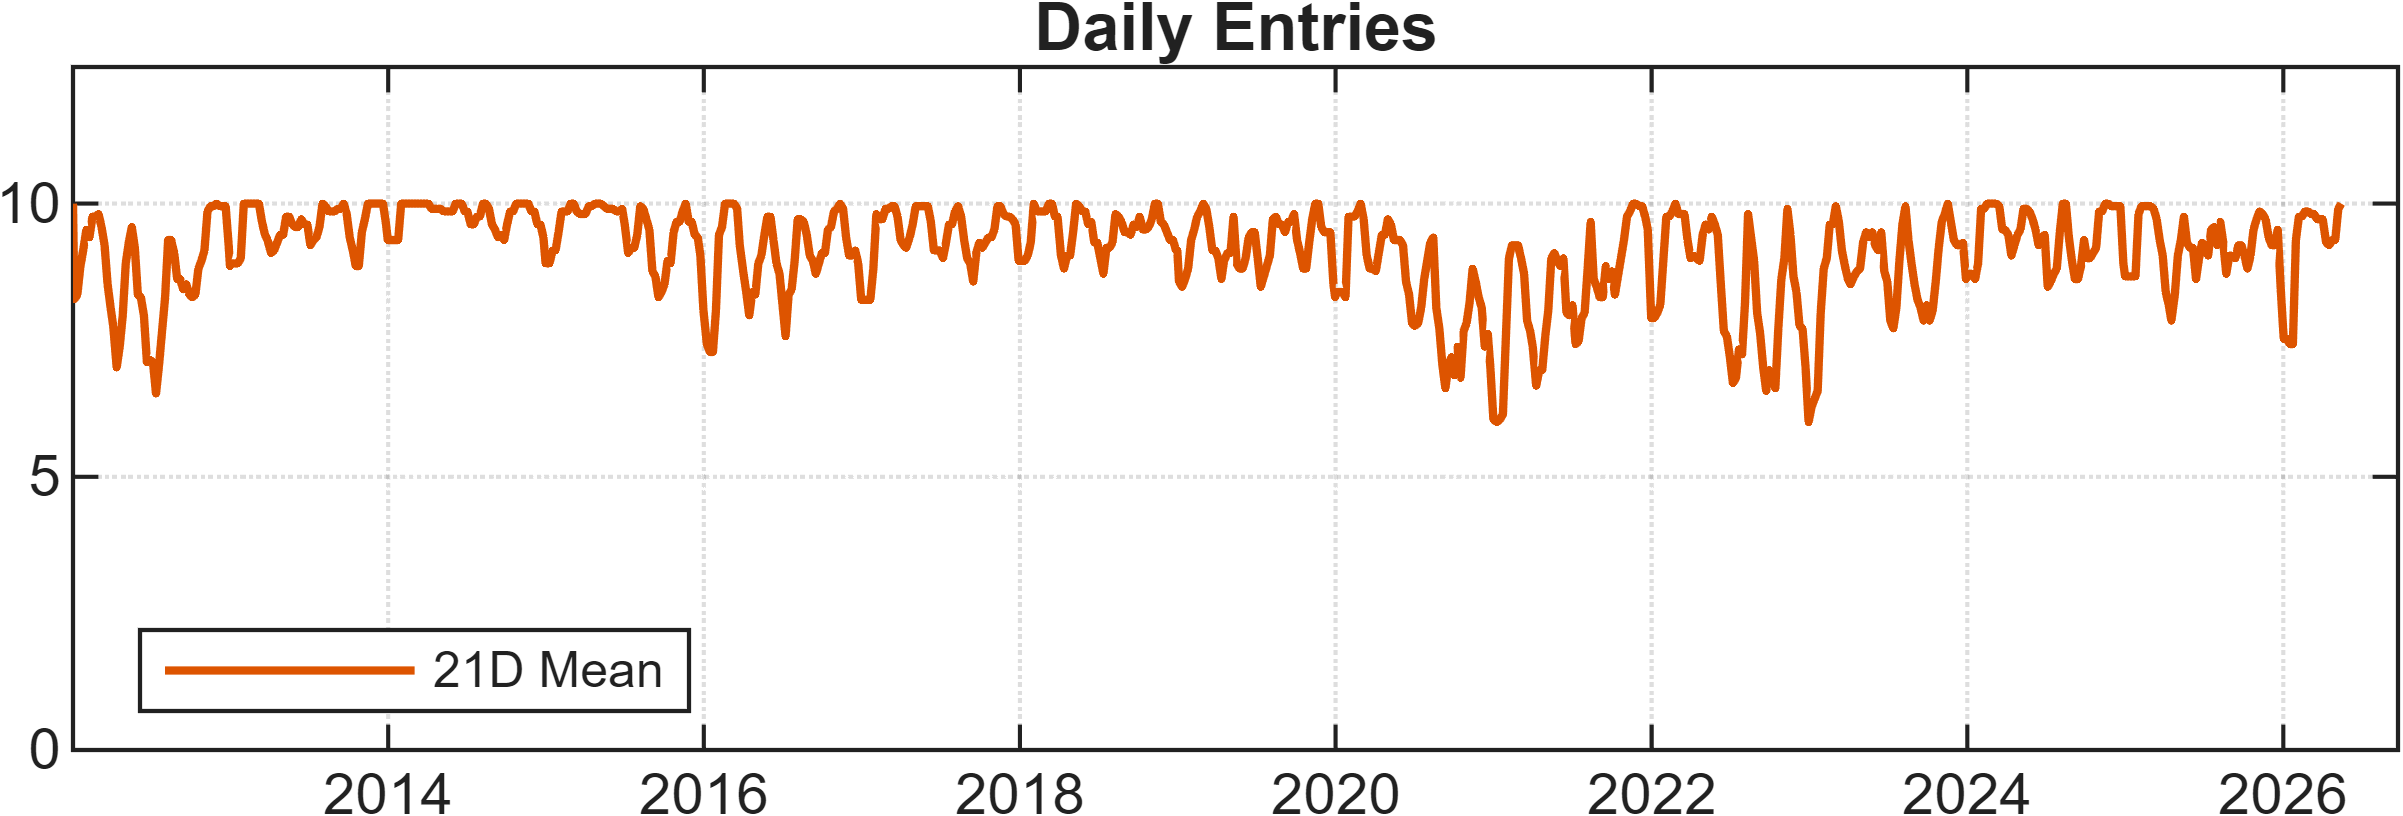
We notice that our selection criteria consistently flag numerous qualifying stocks, with the rolling 21-days average number of daily entries never dropping below 5 across our sample (see the chart above).
This suggests there is enough room to investigate additional features (predictive of positive overnight returns) to be combined with our raw signal and used as Boolean operational filters: these trade/no-trade conditions are typically introduced with the aim of enhancing net-of-fee risk-adjusted returns, since they naturally limit trading activity.
A word of caution, however: introducing additional predictive components also means introducing more complexity into the framework. Any new feature should therefore be both logically grounded and accompanied by a meaningful improvement in performance… one significant enough to justify the increased model risk.
Why Does This Signal Work?
We can think of at least three forces that plausibly contribute to the positive overnight returns we observe.
Short Covering Pressure
From studying how active and aggressive short sellers operate within the small-cap space, it appears that many tend to reduce or fully liquidate their positions late in the trading session rather than carry significant overnight exposure.
Many short sellers seek to reduce overnight exposure late in the session. The resulting buy-to-cover flow may create demand into the close, particularly in thinner names where liquidity is limited. If this flow is only partially absorbed, or if some covering activity continues through after-hours and pre-market trading, part of the associated price pressure may be reflected in the following session's opening price.
The Overnight Risk Premium
The second force at play here is the well-known overnight risk premium, a topic we already touched on in this article.

Researchers have consistently documented that a disproportionate share of long-term equity returns accrues overnight rather than intraday, suggesting that investors holding through the close-to-open period are compensated for bearing event risk (i.e. gap risk): precisely the risk that intraday short sellers spend their careers avoiding.
In gaining exposure to the overnight risk premium, we are simultaneously absorbing the event risk that short sellers are keen to offload at the end of the day: a legitimate source of risk that, we believe, may justify a portion of the returns we observe.
(High) Attention Stocks Effect
Haghani, Ragulin and Dewey (2022) suggest that attention stocks tend to earn consistently positive overnight returns. These are defined as well-known names that attract retail interest, media coverage, options activity and strong recent momentum, characteristics that, the authors note, also tend to coincide with higher beta and volatility.
In a sense, the names our signal flags can be considered attention-grabbing and volatile almost by construction. Our selection criteria may therefore be identifying some of the attention stocks that, within the authors’ framework, tend to appear among the strongest overnight performers.
In practice, we do not believe the effect is driven by a single mechanism alone. Rather, the signal may emerge from the interaction between structural short-selling behavior, overnight risk transfer, and the tendency of speculative attention to concentrate in volatile small-cap names.
Conclusion
The idea we presented in our original piece, although strong in historical performance, showed some pain points in practical implementation: namely, the need to account for locate-fee drag and a structural break that appears to have occurred around the start of 2022, which raises some doubt as to whether the signal will return to performing in line with its historical metrics.
That said, we hope this article serves as a useful illustration that even when an idea does not immediately pan out, digging into adjacent territory can sometimes uncover something valuable.
It should also serve as a reminder that identifying market effects is only a portion of the work that quants do: reasoning about what drives them matters just as much, and the answer is rarely attributable to a single factor, but rather to a more complex combination of multiple forces.
If you found this article useful, feel free to leave a comment and reach out via direct message or email at info@concretumgroup.com for any questions.

Full Methodology
In the following table, we describe step by step the rules we used to construct the strategy presented in this article.