


Last month, we published two articles touching on a topic that over the past year has been, and continues to be, quite central to our research efforts: short-term trading opportunities in single-name equities.
You can access the first two articles by clicking on the banners below.


As we continue to expand our book of strategies, we also try to present our readers with insightful pieces along the way. For obvious reasons we will not be able to disclose certain findings, but we do our best to make what we can available, and we are grateful for our readers’ support.
Continuing along these lines, we conclude the series by focusing on an aspect of trading baskets of single-name equities that we believe is often overlooked: the role of liquidity, not from a purely operational perspective, but as a potential driver of expected returns.
In particular, we investigate whether deeper or thinner liquidity conditions can materially influence the performance of a trading signal whose efficacy has already been established.
In other words: is there an illiquidity premium in short-term stock trading?
Liquidity Buckets
We start by taking the exact signal outlined in When Short Sellers Create Overnight Alpha, where we seek overnight exposure on a handful of selected stocks.
The most straightforward way to determine whether an illiquidity premium exists (i.e. whether we are compensated more for dealing in less liquid securities), is to apply the same signal on subsamples of our trading universe, with each subsample representing a different liquidity bucket.
In particular, at the beginning of each session we rank the names in our universe by their past liquidity and split them into five buckets (quintiles), with Q1 representing the most liquid stocks and Q5 the thinnest ones. The buy and sell engine remains untouched: what changes is just the pool of names it operates on (each bucket runs separately and independently).
Full details on stock selection and portfolio construction are provided at the end of this article, along with additional statistics for an alternative version of the signal that incorporates an operational filter.
Results
If an illiquidity premium existed, we would expect a roughly monotone increase in both raw and risk-adjusted performance metrics as we move from Q1 to Q5, as the signal is allowed to flag stocks in progressively less traded areas of the US market.
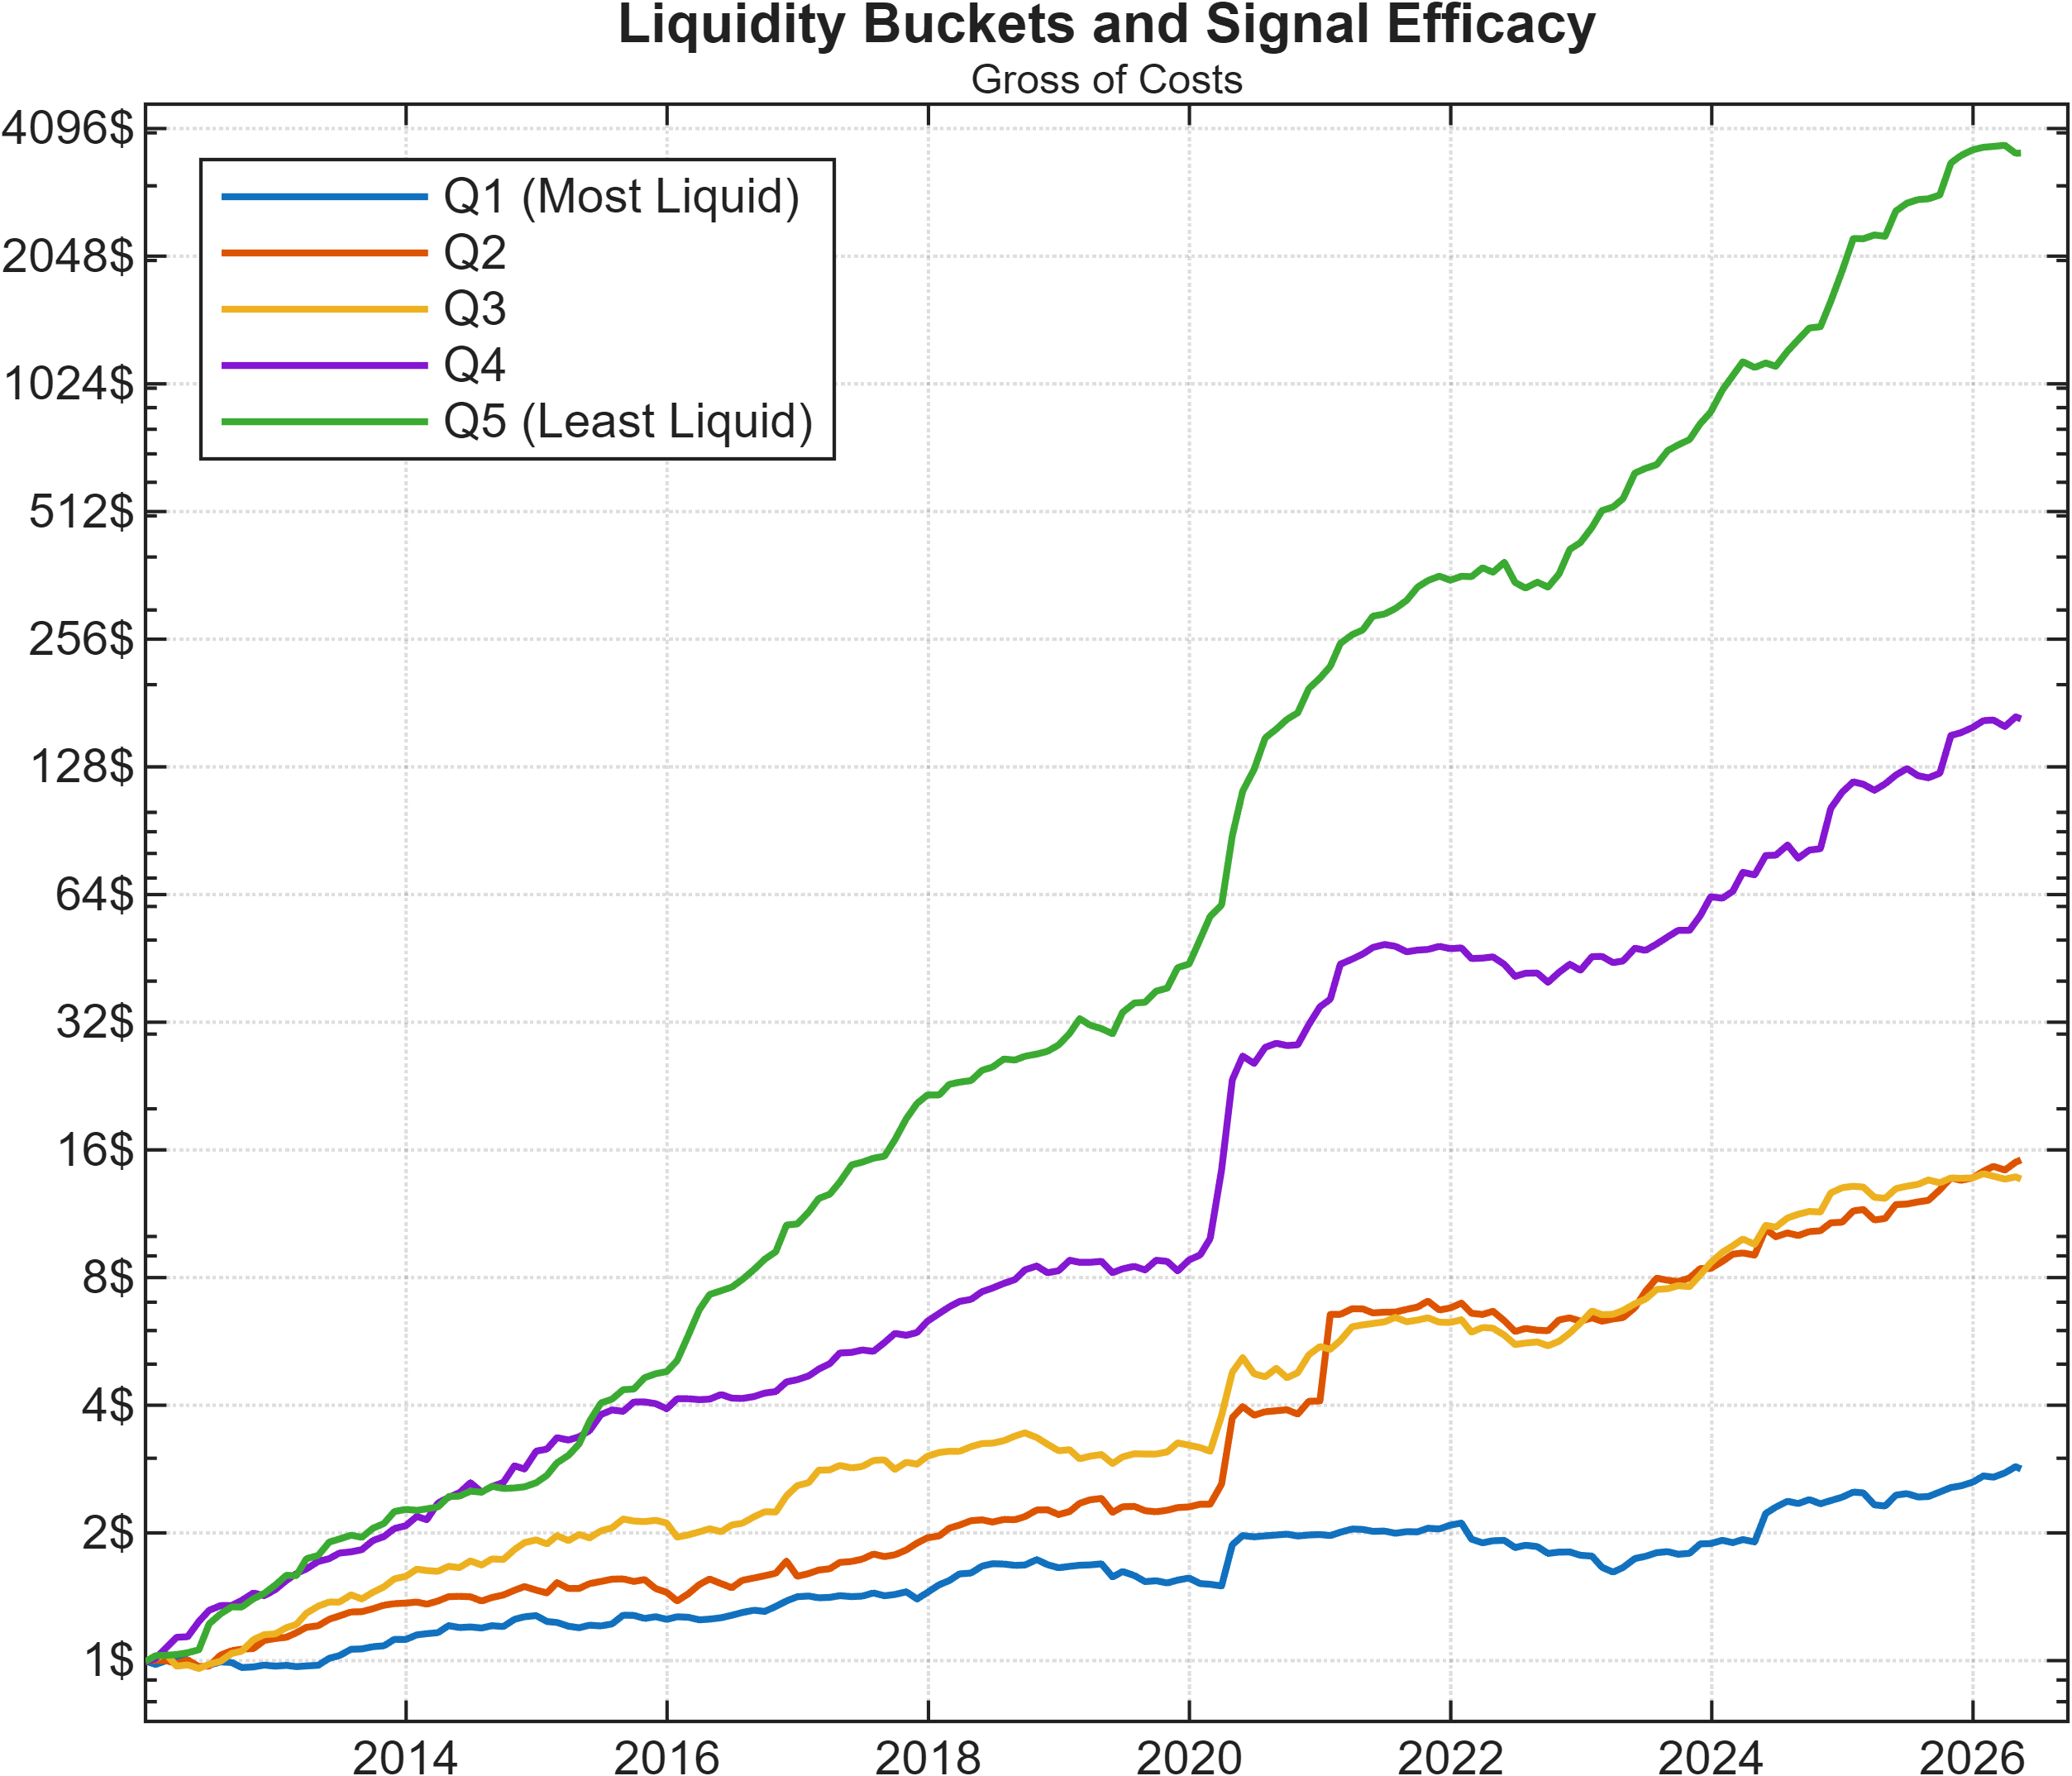
Judging from the AUM progression of the five strategies, the visual evidence for the presence of an illiquidity premium is already quite strong. For reference, some key gross-of-cost performance metrics are summarized in the following table.
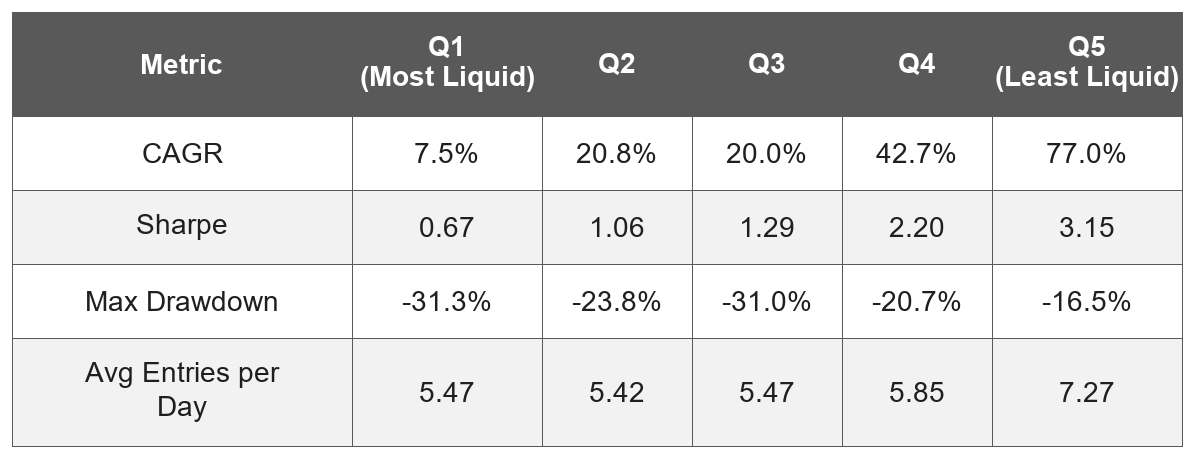
It is striking to see the same signal perform with such a wide performance gap between the most and least liquid names in our universe. Between Q1 and Q5, CAGR increases more than tenfold and Sharpe jumps from 0.67 to a remarkable 3.15, with a maximum drawdown of only –16.5%.
Notably, the difference in performance does not appear to stem from different opportunity sets. All liquidity buckets deliver a comparable number of average entries per day: Q1 through Q4 sit tightly between 5.4 and 5.9, with Q5 running a busier portfolio at roughly 7.3 entries per day on average.
These numbers point firmly in the direction of a strong illiquidity premium at play: the thinner the traded names, the more attractive the expected returns (under the same signal).
The Liquidity Challenge
The idea of an illiquidity premium is not something we invented. It is a well-documented phenomenon in academia, where the underlying rationale is that investors should expect additional compensation for taking on the risk of transacting in illiquid securities.
Amihud and Mendelson (1986) originally linked expected returns to the width of bid-ask spreads, and Amihud (2002) later introduced a price-impact measure of illiquidity that explained variation in stock returns both cross-sectionally and in time-series.
Related to this is the finding that the small-cap factor can amplify other price anomalies, from broad factor-driven effects to signals like the one investigated in this series. Fama and French documented this for the asset-growth effect in Dissecting Anomalies (2008), and Asness et al. showed that once quality is held constant, a stable size premium emerges (Size Matters, If You Control Your Junk, 2018).
In a sense, when studied together, size and liquidity look less like standalone factors and more like amplifiers of whatever other effect a strategy is trying to capture.
So on one side our findings appear to confirm what the academic literature has long established… but that does not mean we should all rush to trade this signal, (or similar ones) in the most illiquid areas of the market.
The reason is simple: those returns, staggering on paper and gross of costs, are by construction extremely hard to harvest.
The table below shows the average liquidity recorded before entry and on the day of entry across all five liquidity buckets.
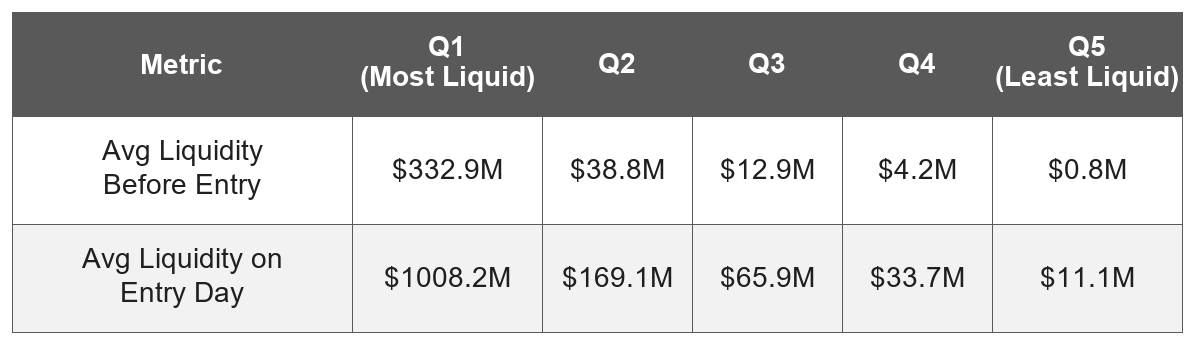
To put things in perspective, Q1 stocks typically trade more than $300M per day before entries flag, whereas Q5 stocks trade only a fraction of that, roughly $800K. For reference, numerous books and resources on stock trading recommend limiting entries to stocks that trade at least $1–5 million per day on average; by those standards, Q5 would be considered by many essentially untradable.
For example, in our 2025 paper Does Trend-Following Still Work on Stocks? we used $1 million (back adjusted for inflation) as a minimum liquidity filter.

It is true that, given the entry conditions we require, eligible stocks tend to experience elevated volumes on the day the signal fires. Viewed this way, Q5 becomes somewhat more accessible at around $11 million: that might give some hope, but the picture remains challenging.
Note - The volume information on entry day is available only at the end of the trading session, as the market closes, and gives us technically no time to execute. If we wanted to use liquidity at entry as a more precise proxy to filter our trading universe, we would need intraday data to backtest it rigorously.
Another issue worth flagging is that Q5 stocks are generally lower priced than Q1 stocks, with average entry prices being considerably higher in the most liquid bucket. This matters more than it might appear: typical broker commission pricing is structured as a fixed cost per share, therefore, lower-priced stocks will inevitably suffer a proportionally greater impact from fees, ultimately eroding a larger portion of the generated dollar P&L.
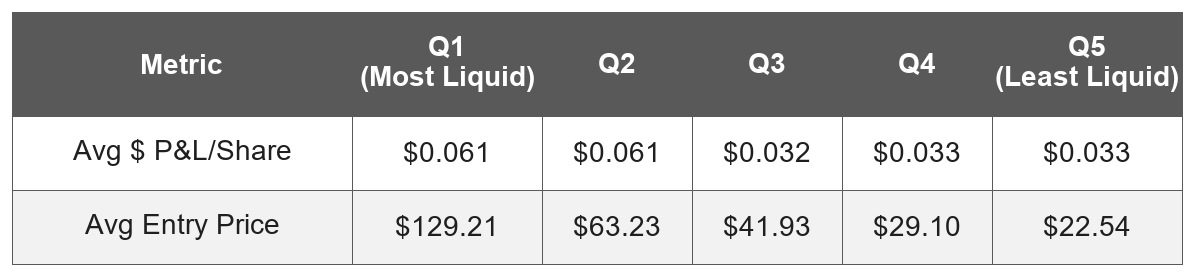
As the table shows, the average dollar P&L per share in Q5 is roughly half that of Q1, despite Q5’s vastly superior performance metrics, which can be traced back to the difference in average entry prices.
A final consideration is slippage. Although the signal we presented can be traded through MOC and MOO orders, both of which aim to minimise slippage by participating in the opening and closing auctions, attempting to place a meaningful order in a stock that trades only a few hundred thousand dollars per day will inevitably push the price against ourselves. This is, in effect, the same problem that the largest players in the industry experience in more liquid markets when deploying billions: the phenomenon is identical, but at drastically different scales.
Conclusion
Overall, we believe this experiment has provided some useful insight around a topic that may look unexciting on the surface but often uncovers fascinating dynamics of markets.
To keep it short, if you are a portfolio manager, or even a well-capitalized retail trader, your hopes of capturing a Sharpe ratio of 3 by trading illiquid names are a touch optimistic…
But if you are a small speculator, know that markets hide pockets of inefficiency and anomalies that your size of capital may be better suited to capture than that of larger participants.
It may seem counterintuitive, but in certain settings the small retail trader working with a few thousand dollars in their account is actually better positioned than those managing millions or tens of millions in allocation.
In a sense, it is Hector against Goliath. If you happen to be the small player, you should not feel discouraged. We suggest that the best thing you can do is put in the work and preparation to uncover the opportunities that are accessible to you and that larger players simply cannot get involved in.
When two investors run the same idea, how much of the difference in performance comes from their order size?

Sometimes knowing which games to play matters more than the strategy itself.
So… What Have we Learned?
Inspired by the upcoming edition of the Market Wizards book, we began this series by analyzing a promising short-selling signal in single-name equities, only to find it brought painful operational obstacles that would make its implementation quite impractical.
Rather than abandoning the idea, the very constraint of securing locates inspired us to explore long-sided opportunities, where we were able to find a more attractive variant of the original strategy… with solid foundations to explain and justify the returns we observed.
Today, we complete this three-part series by showing how something as seemingly unexciting as liquidity can carry important implications not only for execution, but for expected returns as well.
Hopefully, this three-part series has shed some light on aspects of quantitative research that are perhaps less fashionable and underrepresented through the lens of social media, yet constitute the backbone of our work on a daily basis.
If you have topics you would like to see covered in a similar format, feel free to reach out via direct message or email at info@concretumgroup.com. We are always happy to hear your suggestions.

Full Methodology and Extra Findings
In the following table, we describe step by step the rules we used to construct the study presented in this article.